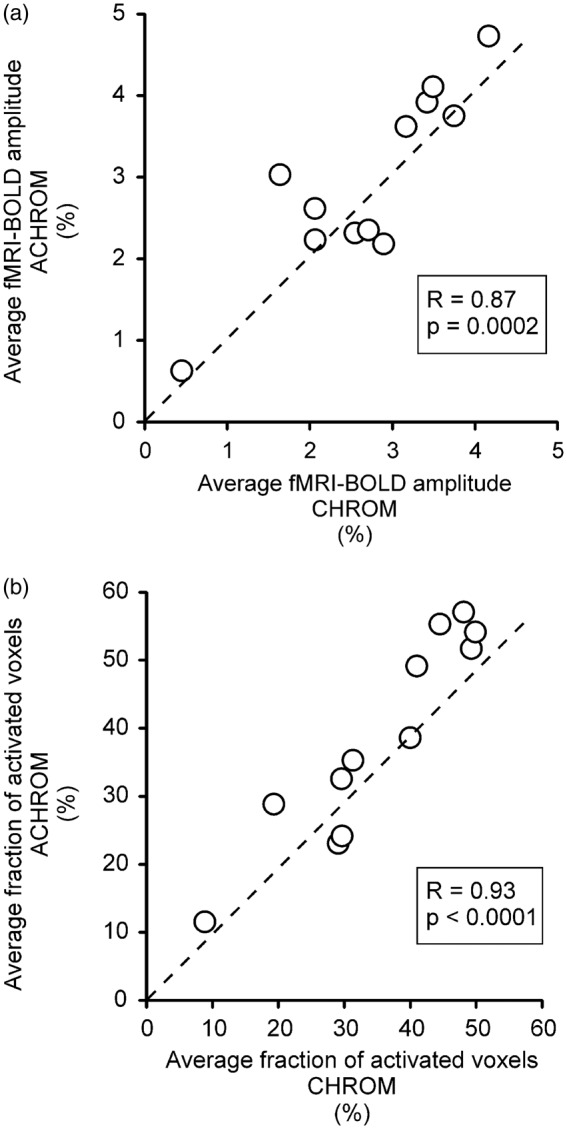
Figure 2.

Comparison of BOLD-fMRI signals evoked by chromatic (CHROM) and achromatic (ACHROM) stimulations. The between-session (within subject) averages of BOLD-fMRI amplitude (a) and BOLD-fMRI fraction of activated voxels (b) were averaged across the volume selected for fMRS. Pearson’s correlation coefficient R and corresponding p-values are reported, the dashed lines indicate lines of identity.
