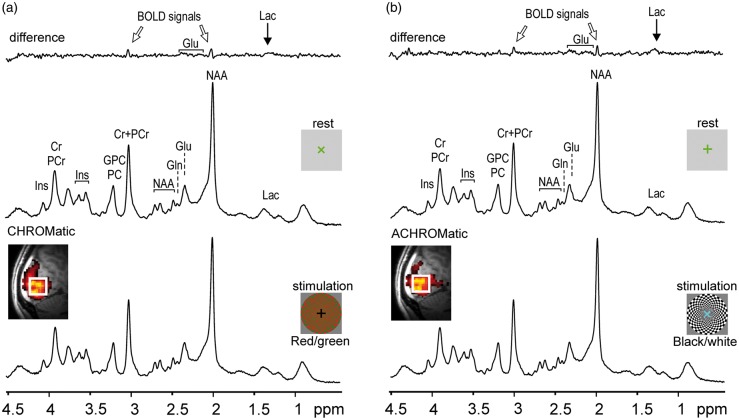
Figure 3.
Representative 1H MR spectra acquired in one fMRS session during four periods, CHROM and subsequent REST (a), ACHROM and subsequent REST (b) (see Figure 1). These 1H MR spectra illustrate the spectral quality routinely achieved in this study (semi-LASER, TE = 26 ms, TR = 5 s, number of scans = 32, VOI = 2 × 2 × 2 cm3). Top traces show the difference spectra (STIM – REST). The residual peaks at 2 and 3 ppm originate from the linewidth difference between STIM and REST spectra. Small concentration changes of lactate (1.3 ppm) and glutamate (∼2.4 ppm) are also discernible in the difference spectra. Gaussian apodization was used for display purposes (σ = 0.17 s) Insets: MPRAGE images with overlaid fMRI maps show the position of the VOI selected for fMRS.

