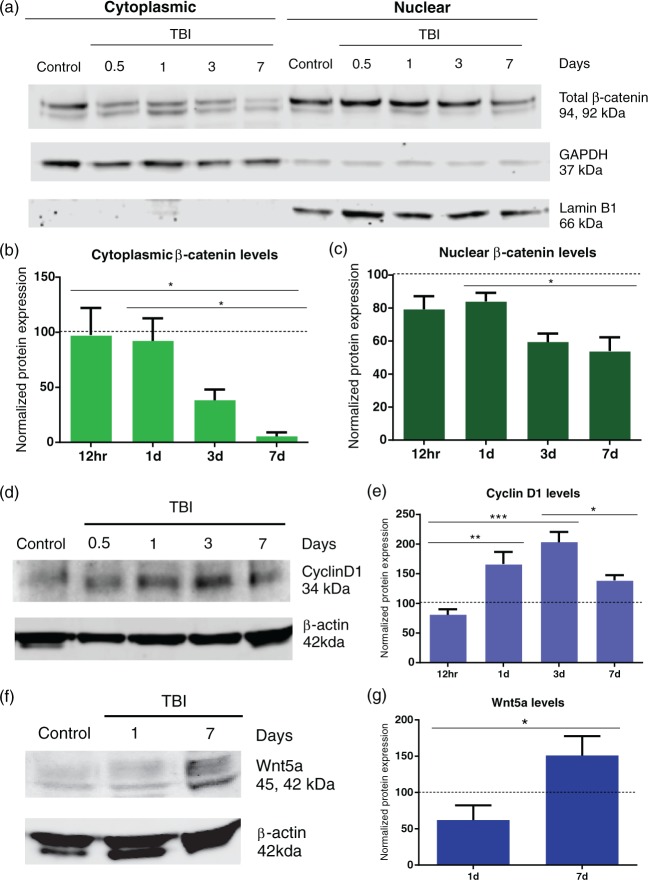
Figure 4.
Temporal decrease in β-catenin levels after TBI. (a) Western blots revealing a gradual decrease in cytoplasmic and nuclear β-catenin protein levels over a time course of 7 d after injury. Control animals showed no changes in β-catenin expression during the 7 d time frame. GAPDH was used as cytoplasmic loading control. Lamin B1 was used as a nuclear loading control; 8 µg loaded per well. (b) Densitometric analysis showing a significant decrease in cytoplasmic β-catenin levels (one-way ANOVA, *p < 0.05) at 7 dpi compared to the 12 h and 1 dpi groups. (c) Similarly, there was a significant decline in nuclear β-catenin levels (one-way ANOVA. *p < 0.05) in the 7 dpi compared to 1 dpi group. Control (n = 13), TBI 12 h (n = 6), 1 dpi (n = 7), 3 dpi (n = 6), and 7 dpi (n = 6) group. (d) Western blot revealed that Cyclin D1 protein levels peak by 3 dpi followed by reduction at 7 dpi. β-actin was used as cytoplasmic loading control; 10 µg loaded per well. (e) Densitometric analysis demonstrating a significant increase in Cyclin D1 levels at 1 and 3 dpi (one-way ANOVA, **p < 0.01, ***p < 0.001) when compared to the 12-h group. Expression peaked at 3 dpi. There was a significant decline in Cyclin D1 levels at 7 dpi (one-way ANOVA, * p < 0.05) compared to the 3 dpi. (f) Western blot revealing an increase in Wnt5a protein levels at 7 dpi compared to 1 dpi. β-actin was used as cytoplasmic loading control. 10 µg loaded per well. (g) Densitometry analysis showing a significant increase in Wnt5a levels at 7 dpi (Student t-test, *p < 0.05) when compared to 1 dpi group.

