Figure 5.
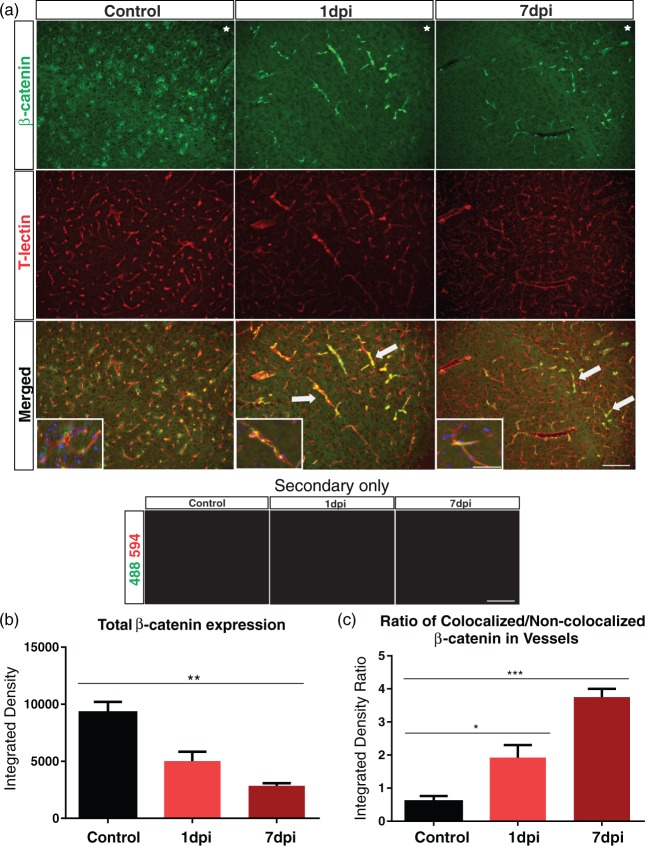
β-catenin is up-regulated in cortical vessels after TBI. (a) Immunohistochemical images from control, 1 and 7 dpi groups. The controls exhibited β-catenin uniform expression in the cortex whereas there was a dramatic loss of expression in the 1 and 7 dpi animals. Vascular loss relative to controls was also observed in the 1 and 7 dpi groups (T-lectin). Interestingly, in the control animals β-catenin expression was observed adjacent to vessels stained with T-lectin, whereas 1 and 7 dpi animals clearly demonstrated β-catenin expression inside vascular structures. Note the increased number of β-catenin+/T-lectin+ vessels in the 1 and 7 dpi groups (arrows). No auto fluorescence was observed in the 594 and 488 channels in any of the tissues. High magnification insert with DAPI illustrates β-catenin-expressing cells adjacent to the vessels in the controls groups and β-catenin+ vessels in the 1 and 7dpi groups. Star indicates region of impact. Scale bar = 100 µm, 50 µm (insert). (b) Densitometric analysis of β-catenin expression in the ipsilateral cortex revealing a significant reduction at 7 dpi compared to controls (one-way ANOVA, **p < 0.01). (c) Analysis of β-catenin localization revealing a significant increase in β-catenin expression in T-lectin+ vessels (increased colocalized/non-colocalized ratio) at 1 and 7 dpi compared to the controls (one-way ANOVA, *p < 0.05, ***p < 0.001).

