Figure 6.
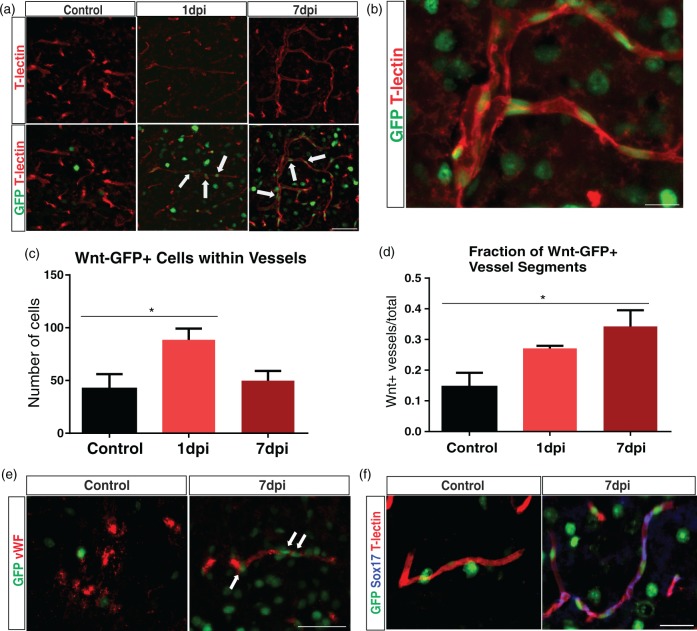
Wnt-GFP-expressing cells are increased inside vascular structures after TBI. (a) We utilized a transgenic mouse line (TCF/LEF:H2B-GFP) to track individual cells with Wnt gene expression. Representative images of control, 1, and 7 dpi groups from the ipsilateral cortex. Few Wnt-GFP vascular cells were seen inside the vessels (T-lectin) in the control group, whereas there was an increase in the 1 and 7 dpi groups (arrows). Scale bar = 50 µm. (b) A vessel from a 7 dpi animal showing Wnt-GFP vascular cells inside blood vessels. Scale bar = 15 µm. (c) Quantitative analysis revealing a significant increase in the number of Wnt-GFP vascular cells at 1 dpi (one-way ANOVA, *p < 0.05) which was followed by decrease at 7 dpi (one-way ANOVA, p = 0.09). (d) Quantitative analysis revealing a significant increase in Wnt-GFP-positive vessel segments at 7 dpi compared to the controls (one-way ANOVA, *p < 0.05). (e) Immunofluorescence of GFP (green) and von Willebrand Factor (vWF; red) in control and 7 dpi group. The control group exhibited heterogeneous vWF expression throughout the brain. In contrast, 7 dpi group showed vWF expression in blood vessels around the impact site. Wnt-GFP vascular cells were found in and around most of these vessels (arrows). Scale bar = 50 µm. (f) Immunofluorescence of Sox17 (blue), GFP (green), and T-lectin (red) in control and 7 dpi group. Sox17 expression is up-regulated in vessels after 7 dpi and colocalizes with GFP+ vessels in Wnt reporter mice. Scale bar = 50 µm.

