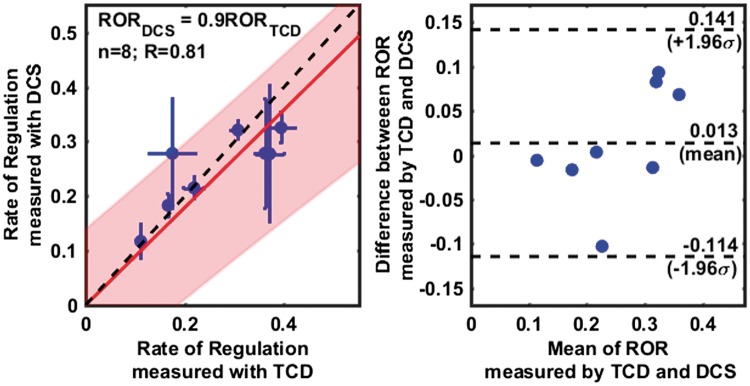
Figure 4.
Comparison of the rates of regulation measured using TCD and DCS (cerebral), excluding outliers. A scatter plot on the left panel, shows a linear relationship (R = 0.81) between RORTCD and RORDCS. Individual data points are shown with a blue circle (horizontal and vertical error bars indicate uncertainties in the estimate of ROR as measured by TCD and DCS), with a linear fit line (solid red), the 95% confidence interval of linear fit (shaded red region) and a 1:1 line (dashed black). The slope of the regression line was estimated to be 0.9 ± 0.18. A Bland–Altman plot in right panel shows the distribution of individual measurements between 95% confidence intervals for agreement (top, and bottom dashed horizontal lines), as well as a small error (0.01) between the measurements (middle dashed horizontal line), that is not significantly different from zero (see also, Supplemental Figure 2).

