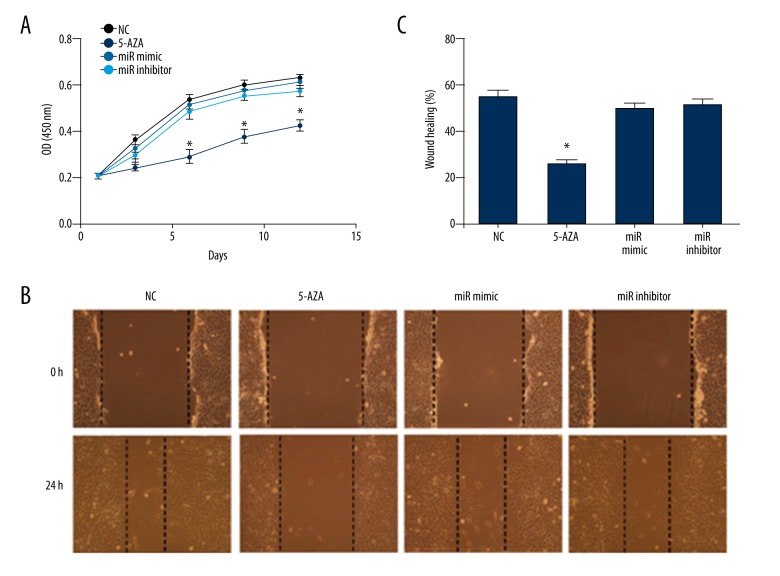
Figure 4.
BMSCs proliferation and migration. (A) Cell growth curve in normal control BMSCs, 5-azacytidine treated BMSCs, miR-199b-5p mimic and inhibitor transfected BMSCs in CCK-8 assay. (B) Cell migration in the aforementioned four groups at 0 hours and 24 hours. (100×) (C) Quantitative analysis of wound healing by cells migration distance in the aforementioned groups; * p<0.05, n=3.

