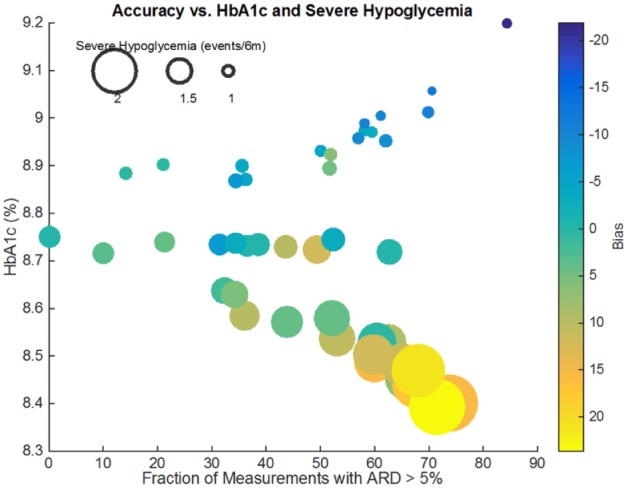
Figure 6.

Relationship between error, bias, HbA1c, and severe hypoglycemia. Each meter is represented by a colored dot. The x-coordinate represents error, while the y-coordinate represents the resulting HbA1c. The size of the dot is proportional to the number of severe hypoglycemia events in 6 months, while the dot’s color shows the meter’s systematic bias.
