Figure 7.

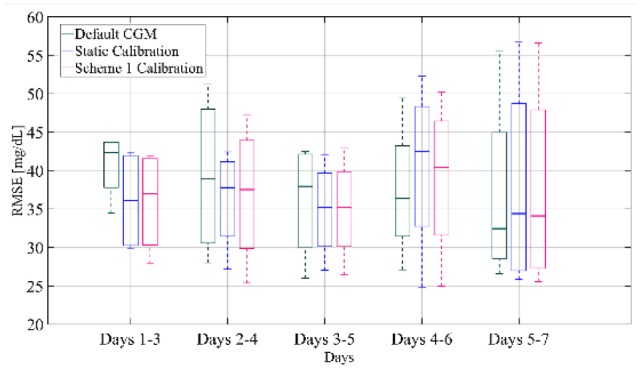
Box-and-whisker plot representation of RMSE distribution over all subjects and all weeks of the training set computed for separate segments of the week for the default CGM, the static calibration and calibration augmented with Scheme 1.

Box-and-whisker plot representation of RMSE distribution over all subjects and all weeks of the training set computed for separate segments of the week for the default CGM, the static calibration and calibration augmented with Scheme 1.