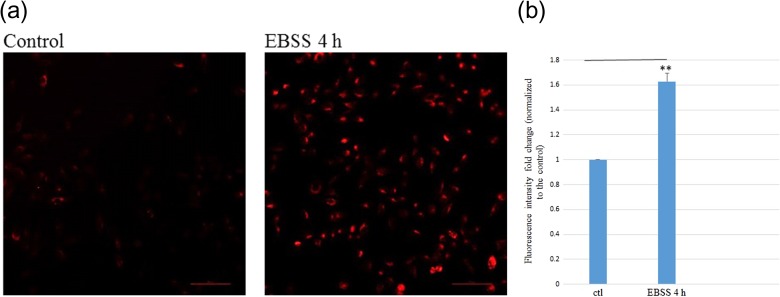
Fig. 4.
Data of starvation of HeLa cells by EBSS. (a) Representative LysoTracker Red staining results of control HeLa cells and those subjected to EBSS starvation for 4 h captured using a fluorescence microscope at ×20 magnification. Scale bar = 100 μm. (b) Fold changes in LysoTracker Red fluorescence intensities in ctl and EBSS 4h (HeLa cells treated with EBSS for 4 h) groups of HeLa cells (normalized to that for the control ‘ctl’). Independent experiments were performed in triplicates and repeated three times. **P < 0.01, and error bars represent ± SEM.

