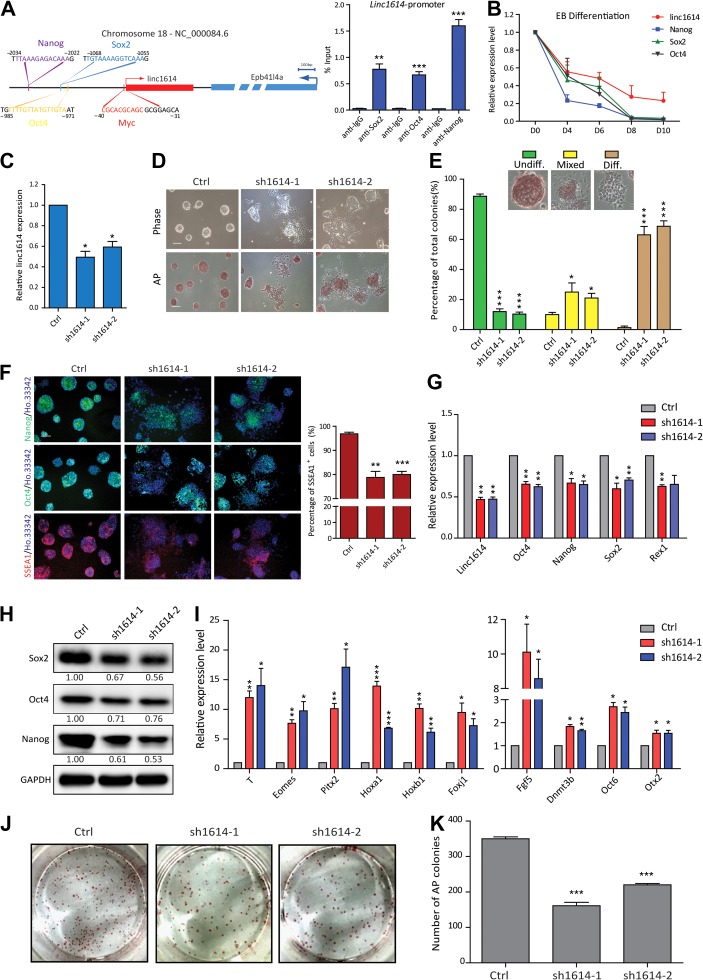
Figure 1.
Linc1614 is critical for the pluripotency of ESCs. (A) Schematic of the mouse linc1614 locus at chr.18 (left). Arrows mark transcription start sites (TSSs), and linc1614 and its adjacent gene Epb41l4a are depicted in red and blue, respectively. Potential binding sites for the transcription factors Myc (−31/−40), Oct4 (−971/−985), Sox2 (−1055/−1068), and Nanog (−2022/−2034) are indicated. ChIP-qPCR for Sox2, Oct4, and Nanog binding at the promoter regions of linc1614 (right). Data were presented as mean ± SD (n = 3). Student’s t-test (**P < 0.01 and ***P < 0.001) was performed relative to IgG. (B) The expression level of linc1614 and core factors (Sox2, Oct4, and Nanog) was decreased on the indicated days (0, 4, 6, 8, and 10) of ESC differentiation in embryoid bodies. (C) qPCR analysis of two distinct shRNAs targeting linc1614 (sh1614-1/sh1614-2) in ESCs. Ctrl represented scramble shRNA with no specific target on the genome. (D) ESC morphology (top) and alkaline phosphatase (AP) activity (bottom) of control and sh1614 ESCs. Scale bar, 100 μm. (E) Statistical analysis of the colony morphology of control and sh1614 ESCs. The colonies were scored into three categories (undifferentiated, mixed, and differentiated) as indicated. Data were presented as mean ± SD from three independent experiments, with >250 individual colonies counted in each independent experiment. (F) Immunofluorescence detection of Oct4, Nanog, and SSEA1 in control and sh1614 ESCs (left). Scale bar, 100 μm. FACS analysis for the percentage of SSEA1-positive cells in control and sh1614 ESCs (right). (G and H) The expression of pluripotency-related genes such as Oct4, Sox2, Nanog, and Rex1 was significantly decreased in sh1614 ESCs, as measured by qPCR (G) and western blotting (H). (I) qPCR analysis of developmental genes such as T, Eomes, Pitx2, Hoxa1, Hoxb1, and Foxj1 and EpiSC markers such as Fgf5, Dnmt3b, Oct6, and Otx2 following the knockdown of linc1614. (J and K) Knockdown of linc1614 attenuated the capability of ESCs to form colonies. The colonies were stained for AP activity on Day 5 of culture under ESC culture conditions. Data were presented as mean ± SD (n = 3). Student’s t-test (*P < 0.05, **P < 0.01, and ***P < 0.001) was performed relative to control ESCs.

