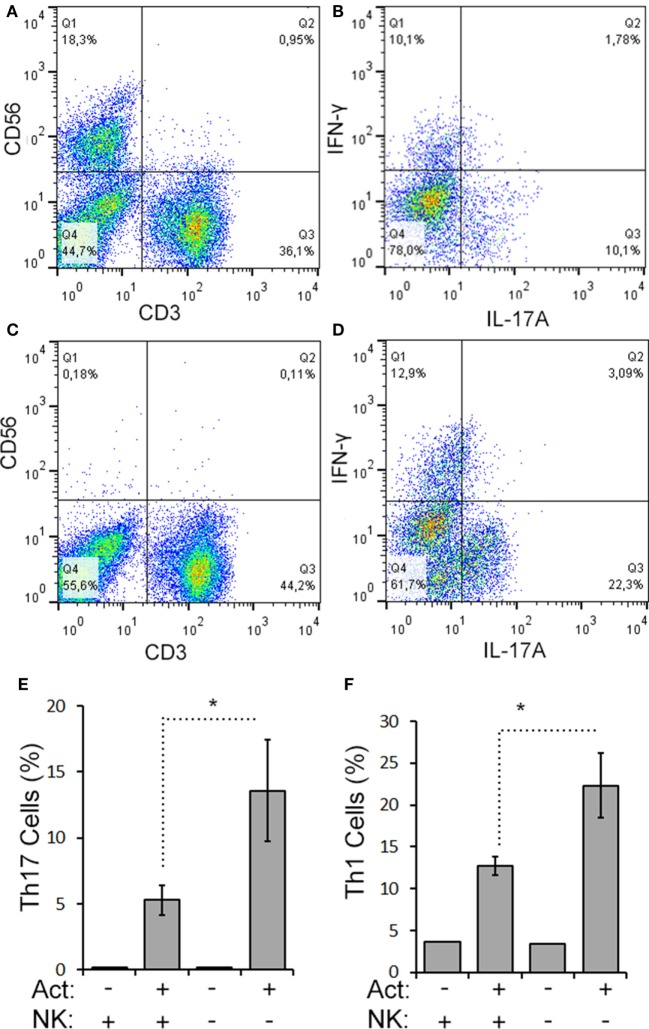
Figure 4.
CD56+ cells suppress Th17 and Th1 cell responses in aHSCT. CD56+ cells were depleted from MS patient PBMC samples collected at 12 months post-aHSCT. Representative plots are shown for complete (A,B) and CD56-depleted samples (C,D). Cells were activated in vitro with anti-CD3, anti-CD28, and Th17 polarizing factors (Act) for 4 days. The proportions of Th17 and Th1 cells were assessed by analysis of cytokine production by intracellular flow cytometry. Representative plots are shown for complete samples (B) and CD56-depleted samples (D). The average proportion of Th17 (E) or Th1 cells (F) is shown. N = 3 patients.

