
Figure 2. Development of a method to quantitatively measure relative abundances of tens of endogenous proteins in parallel in single Xenopus eggs.
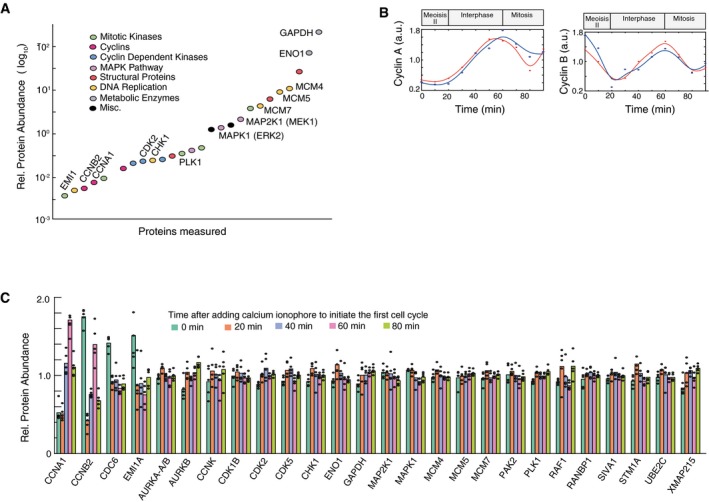
- Comparison of protein abundance of a set of cell cycle, signaling and control proteins in Xenopus eggs. Abundance measurements are based on SRM‐MS measurements of the combined cell extracts from 5 eggs collected at the same time and before initiation of the first cell cycle. Quantitation of relative protein abundance was carried out by adding heavy isotope‐labeled reference peptides to the egg extracts.
- Timecourse analysis of changes in Cyclin A and Cyclin B levels during the first Xenopus cell cycle measured in combined cell extracts from 5 eggs per timepoint.
- Five individual eggs were collected at five timepoints: 0, 20, 40, 60, and 80 min after the addition of calcium ionophore. To minimize variability due to sample handling and instrument sources, the 25 individual eggs were prepared for mass spectrometry analysis at the same time and were then analyzed in sequential runs on the same mass spectrometer. Barplot shows relative abundance changes of the 26 proteins shown in (A) tracked through the first egg cell cycle. Each black dot represents the value from an individual egg.