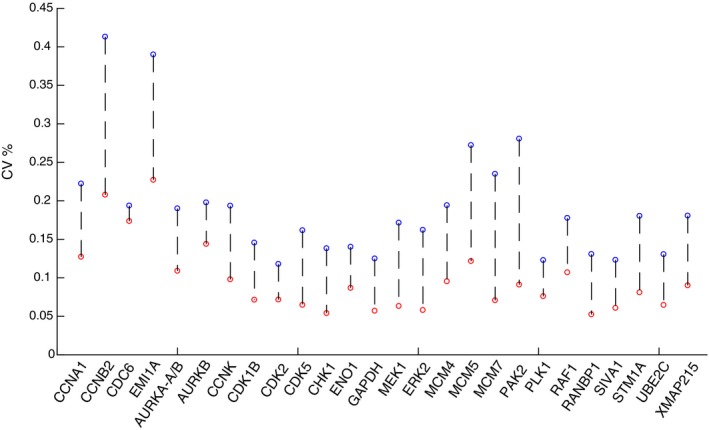
Figure EV3. Bootstrap analysis of CVs of the relative abundance of 26 proteins using a 60‐egg set collected at 60 min after egg activation.

Bootstrapping of random samples was performed 2,000 times with replacement. We used the bootstrap analysis to determine CVs for the entire 60‐egg dataset (blue circles) or on six batches of 10 eggs that were sequentially analyzed on the mass spectrometer (red circles). The lower CVs for batches of sequentially analyzed cells (median CV of 9% for the 26 proteins) argues that accurate concentration comparison using SRM analysis is optimally performed in batches of samples analyzed sequentially.
