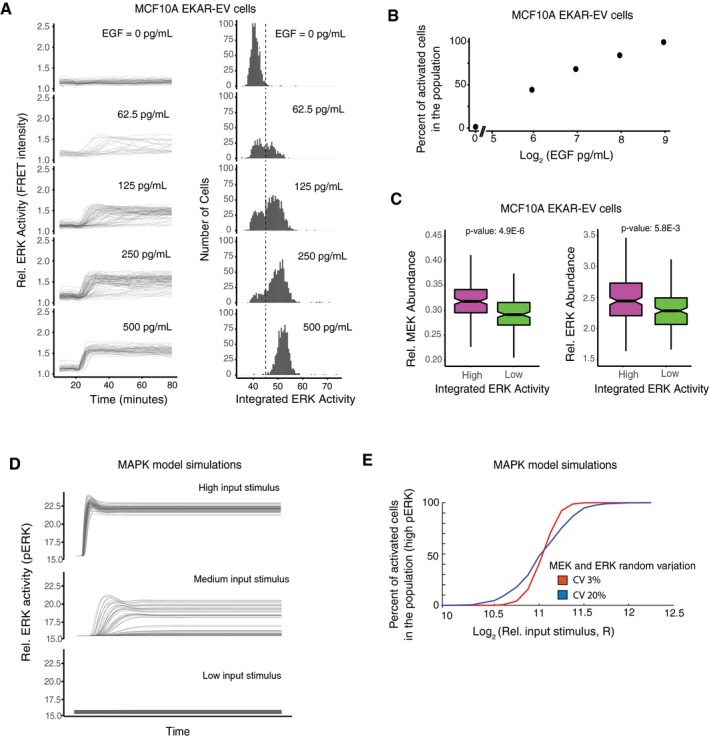
MCF10A cells stably expressing the EKAR‐EV FRET sensor were activated with varying concentrations of EGF after being serum starved for at least 48 h. Cells were imaged every 2 min throughout the timecourse. (left) The plots at EGF doses of 0, 62.5, 125, 250, and 500 pg/ml show FRET intensity timecourses from approximately 800, 520, 1,200, 1,000, and 900 individual cells, respectively. (right) Histograms show the corresponding integrated ERK activity of individual cells. Integrated ERK activity was calculated for each timecourse as the area under the curve after the addition of EGF. The dashed line shows the threshold used to distinguish cells with active versus inactive ERK.
Plot showing percentage of activated cells (cells to the right of the threshold plotted in (A)) in response to different EGF concentrations.
Box‐and‐whisker plots of MEK (left) and ERK (right) concentrations in cells with high (top 15%, magenta) or low (bottom 15%, green) integrated ERK activity in response to EGF stimulation. The high and low conditions represent 162 and 161 cells respectively, out of a total of 1,073 cells, stimulated with 3,000 pg/ml of EGF (MEK plots), and 198 and 197 cells respectively, out of a total of 1,316 cells stimulated with 125 pg/ml of EGF (ERK plots). In the box‐and‐whisker plots, the bold line in the center of the notch represents the median, the ends of the notched box represent the first and third quartiles, the length of the upper whisker shows the largest point no more than 1.5 times the inter‐quartile range (IQR or length of the box), the lower whisker represents the smallest point no more than 1.5 times the inter‐quartile range, and the notches represent 1.58 * IQR/sqrt(n), which approximates the 95% confidence interval of the median. The non‐overlapping notches between the high and low populations, as well as the low P‐values, indicate that the differences between the two populations are statistically significant.
Timecourse output from an established MEK/ERK model (Sturm
et al,
2010) in response to high, medium, and low concentrations of input (RasGTP) stimulus shows that the output for intermediate stimuli is bimodal with mainly either high pERK or low pERK cells separated by a threshold pERK intensity of approximately 17. Random lognormal noise with 15% CV was applied to MEK and ERK and 10% CV to the input stimulus (RasGTP).
Model simulations resulting from applying random lognormal noise with different CVs to MEK and ERK. In all cases, random lognormal noise with 10% CV was applied to the input stimulus (RasGTP).

