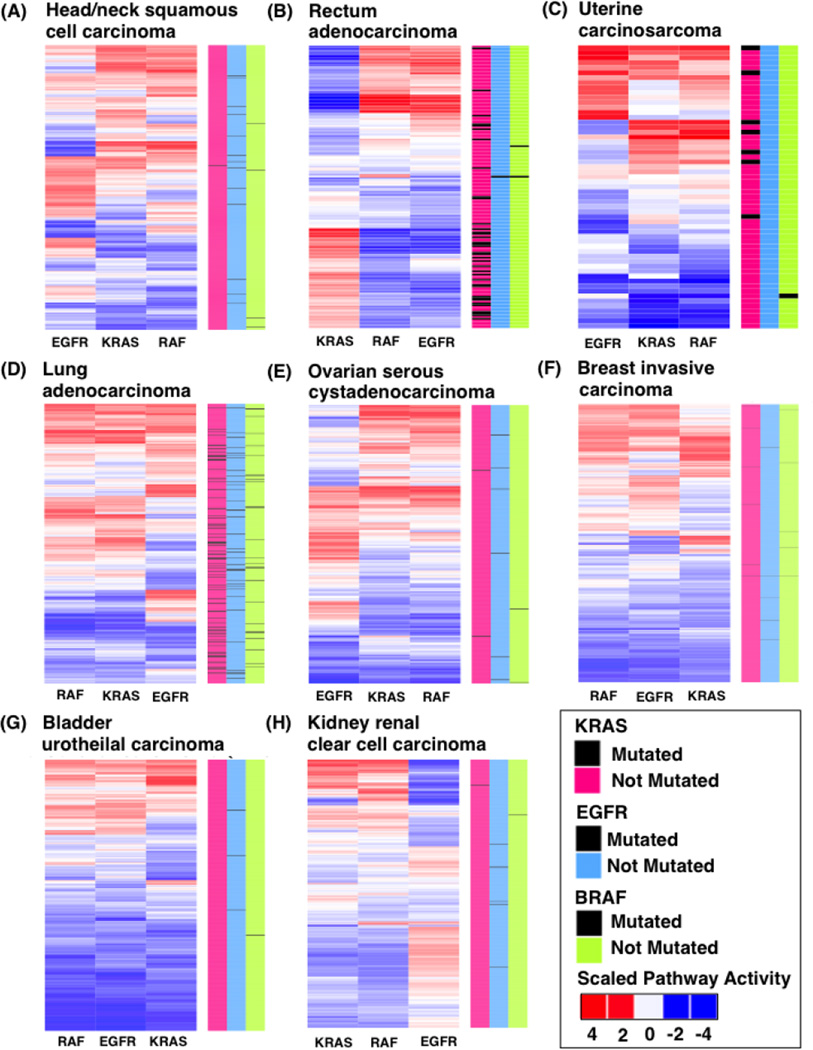
Figure 2.
Scaled pathway activation scores for the EGFR, RAF, and RAS pathway from patient TCGA data. (A) head and neck squamous cell carcinoma, (B) rectum adenocarcinoma, (C) uterine carcinoma, (D) lung adenocarcinoma, (E) ovarian serous cystadenocarcinoma, (F) breast invasive carcinoma, (G) bladder urothelial carcinoma, and (H) kidney renal clear cell carcinoma. Red values indicate high pathway activity and blue represent low pathway activity. Color bars on the right side represent different gene mutations in KRAS (pink), EGFR (light blue), and BRAF (green). Black bars in gene columns indicate presence of mutations.

