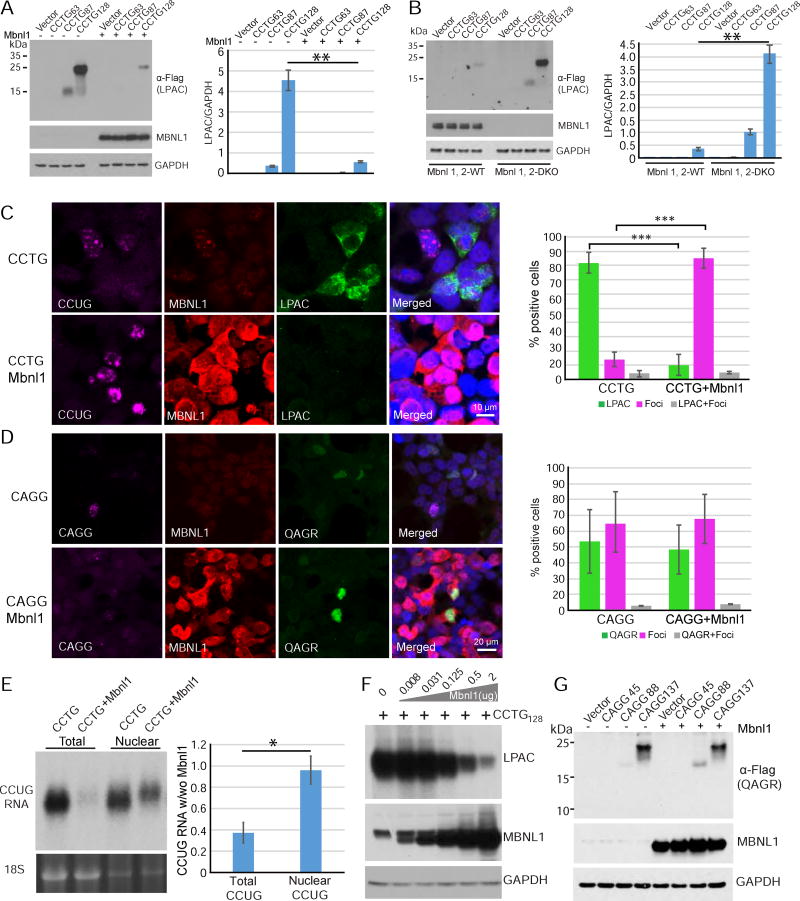
Figure 5.
RAN translation across CCTG•CAGG expansion is regulated by Mbnl1 proteins. (A) LPAC RAN proteins are decreased by protein blot analysis in HEK293T cells cotransfected with CCTG expansion and Mbnl1 constructs. (B) LPAC RAN proteins are increased in Mbnl1, 2 DKO MEFs transfected with constructs containing varying number of CCTG repeats. (C) IF labeling with CAGG RNA probe (purple) and antibodies against MBNL1 (red) and tagged-LPAC proteins (green) in transfected HEK293T. (D) IF labeling with CCTG RNA probe (purple) and antibodies against MBNL1 (red) and tagged-QAGR proteins (green) in transfected HEK293T. (C,D) Cells positive for RAN LPAC or QAGR protein staining are inversely related to cells positive for nuclear CCUG or CAGG RNA foci with Pearson’s correlation coefficients of r = −0.999 and −0.998, respectively. Percentage of cells expressing RAN only, foci only or RAN and foci are shown on the right. Levels of RAN LPAC but not QAGR are affected by MBNL1 overexpression. (E) RNA blot showing enrichment of nuclear CCUG transcripts compared to total RNA in cells overexpressing MBNL1 with 18S RNA as loading control (lower panel). (F) Protein blot showing dose-dependent decreases in steady state levels of LPAC protein with increasing MBNL1 protein expression. (G) Protein blot showing QAGR RAN protein levels are not affected by MBNL overexpression. Error bars show S.E.M. n≤3/group with * p<0.05, ** p<0.01 and *** p<0.001. See also Figures S6–8.

