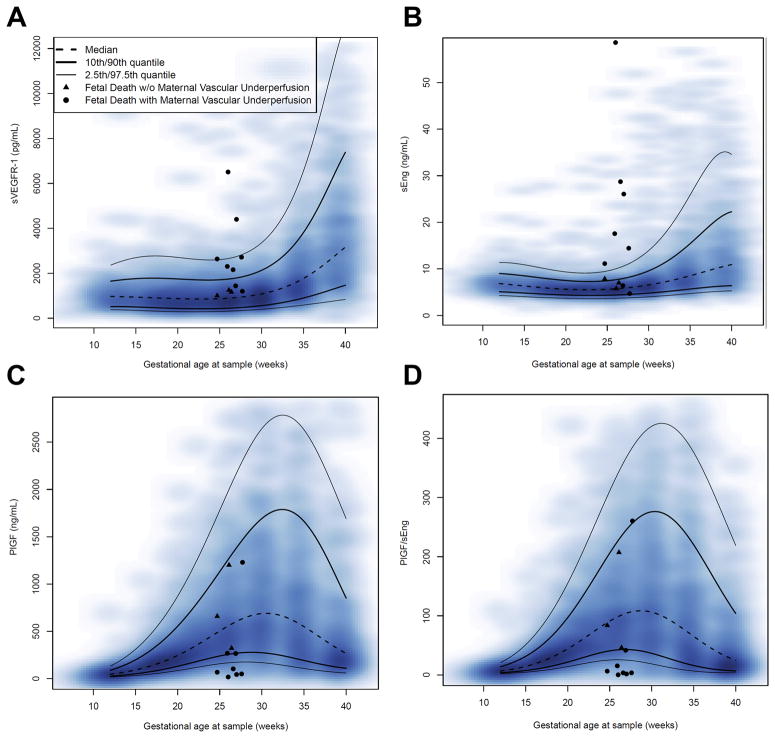
Figure 1. Concentrations of maternal plasma angiogenic and anti-angiogenic factors in patients with fetal death.
For each fetal death case, data for one sample collected at 24–28 weeks are shown; triangles identify cases without placental lesions of maternal vascular underperfusion (MVU) and filled circles represent cases with MVU. The lines correspond with the percentiles of the analytes (or ratios) (2.5th, 10th, 50th, 90th, and 97.5th centiles). The distribution of the raw longitudinal data used to derive the percentiles is shown using a heat map; the color intensity denotes the frequency of the data points for the corresponding gestational age: A) soluble vascular endothelial growth factor receptor-1, B) soluble endoglin, C) placental growth factor and D) placental growth factor/soluble endoglin ratio.

