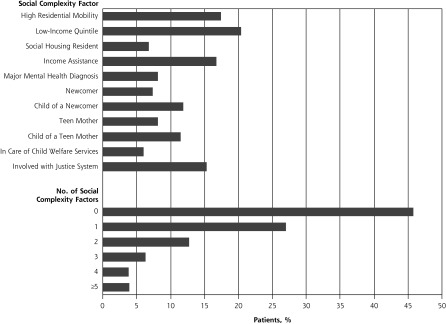
Figure 1.
Prevalence of individual social complexity factors and distribution of patients according to number of factors.
Notes: Analyses based on entire study cohort (N = 626,264), except for teen mother (restricted to female patients, N = 332,542); in care of Child Welfare Services (restricted to youth ≤18 y, N = 134,415); and child of a newcomer (restricted to newcomers ≤18 y, N = 125,624). See Methods for definitions of social complexity factors.

