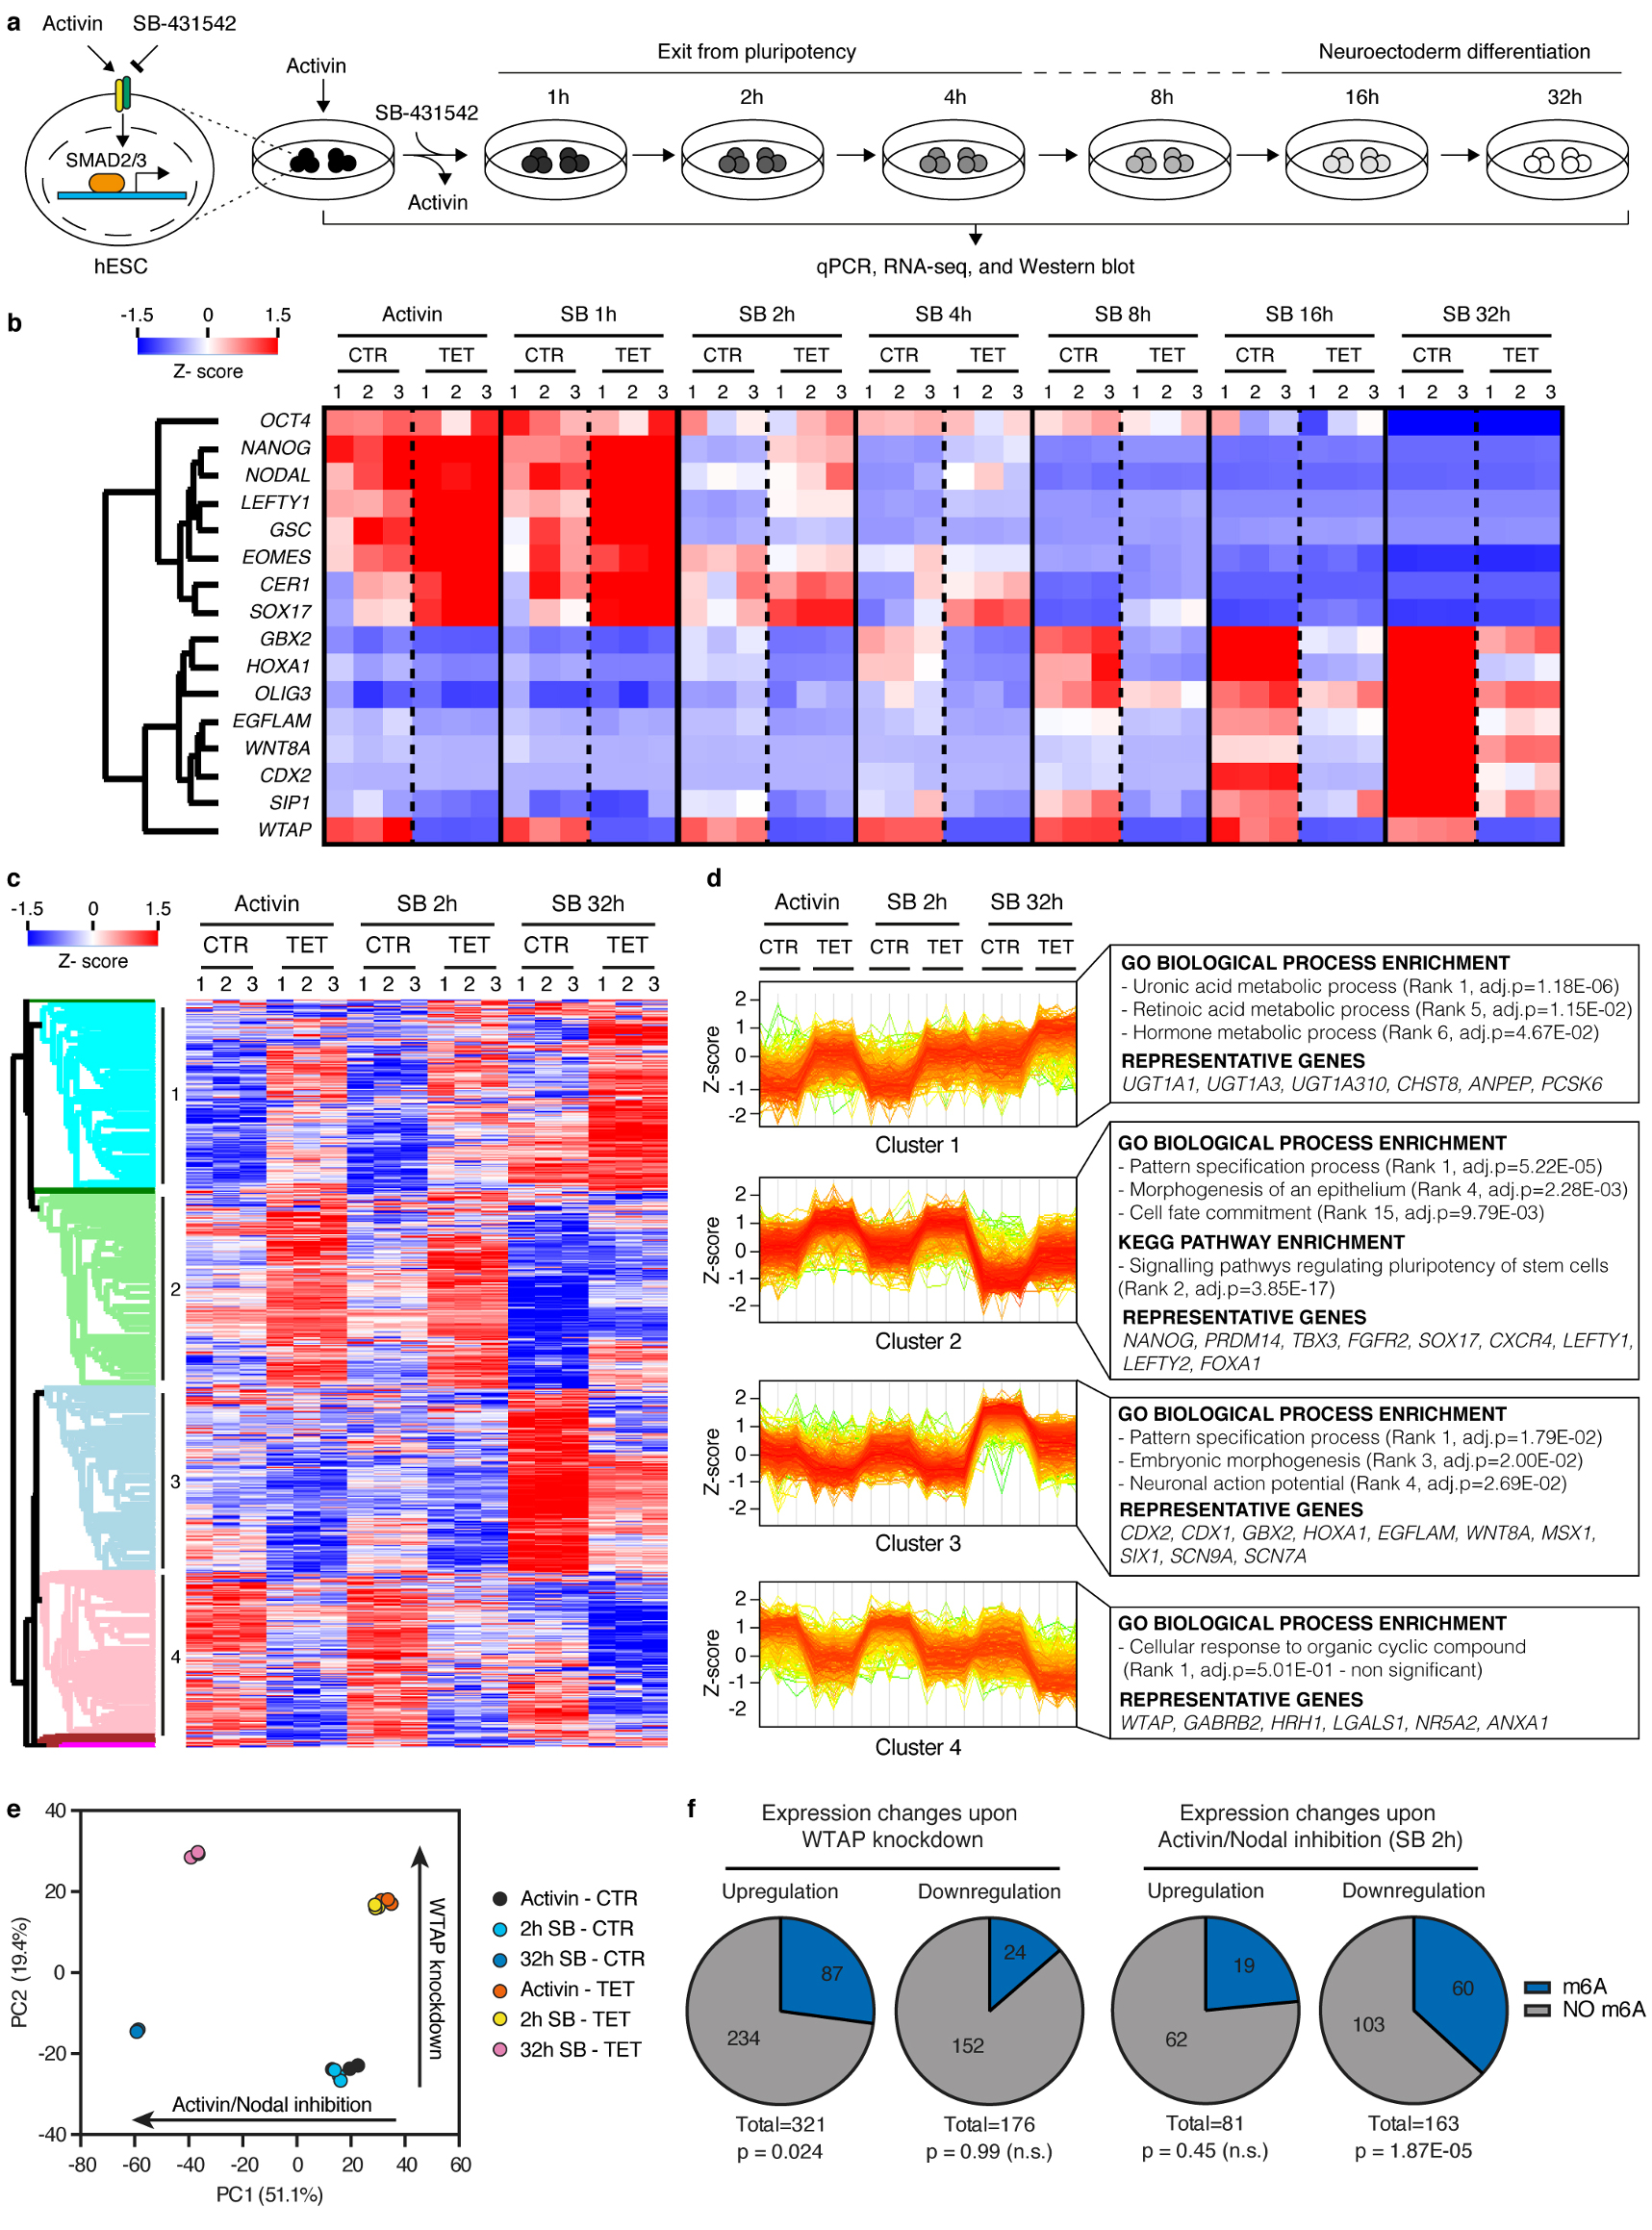
Extended Data Figure 10. Genome wide analysis of the relationship between WTAP and Activin/Nodal signalling.

(a) Schematic of the experimental approach to investigate the transcriptional changes induced by the knockdown of the m6A methyltransferase complex subunits during neuroectoderm specification of hESCs. (b) qPCR analyses of WTAP inducible knockdown (iKD) hESCs subjected to the experiment illustrated in panel a (n=3 cultures). Activin: cells maintained in standard pluripotency-promoting culture conditions containing Activin and collected at the beginning of the experiment. SB: SB-431542. Z-scores indicate differential expression measured in number of standard deviations from the average across all time points. (c) RNA-seq analysis at selected time points from the samples shown in panel b (n=3 cultures). The heatmap depicts Z-scores for the top 5% differentially expressed genes (1789 genes as ranked by the Hotelling T2 statistic). Genes and samples were clustered based on their Euclidean distance, and the four major gene clusters are indicated (see the Supplementary Discussion). (d) Expression profiles of genes belonging to the clusters indicated in panel c. Selected results of gene enrichment analysis and representative genes for each cluster are reported (cluster 1: n=456 genes; cluster 2: n=471 genes; cluster 3: n=442 genes; cluster 4: n=392 genes; Fisher’s exact test followed by Benjamini-Hochberg correction for multiple comparisions). (e) Principal component analysis (PCA) of RNA-seq results described in panel c (n=3 cultures). The top 5% differentially expressed genes were considered for this analysis. For each of the two main principal components (PC1 and PC2), the fraction of inter-sample variance that they explain and their proposed biological meaning are reported. (f) Proportion of transcripts marked by at least one high-confidence m6A peak23 in transcripts significantly up- or downregulated following WTAP inducible knockdown in hESCs maintained in presence of Activin (left), or following Activin/Nodal inhibition for 2 hours with SB in control cells (right). Differential gene expression was calculated on n=3 cultures using the negative binomial test implemented in DEseq2 with a cutoff of p<0.05 and abs.FC>2. The number of genes in each group and the hypergeometric probabilities of the observed overlaps with m6A-marked transcripts are reported (n.s.: non-significant at 95% confidence interval).
