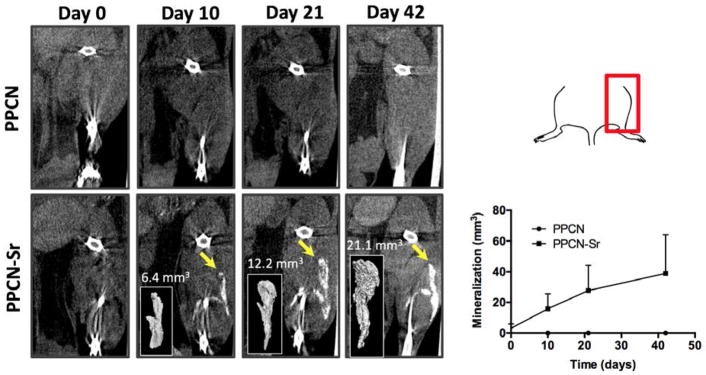
Figure 6.
MicroCT analysis of intramuscular femoral injection of PPCN and PPCN-Sr is shown from day 0 to day 42. The top right panel orients the microCT images onto the mouse femur. The bottom right panel shows the quantification of the microCT images, n = 3. Mineralization is observed in the PPCN-Sr group beginning at day 10 and increasing consistently through the 6 week period. No mineralization is observed in the non-functionalized PPCN control. Mineralized regions were quantified with Osirix by threshold intensity and reconstructed to show the 3D inlay.

