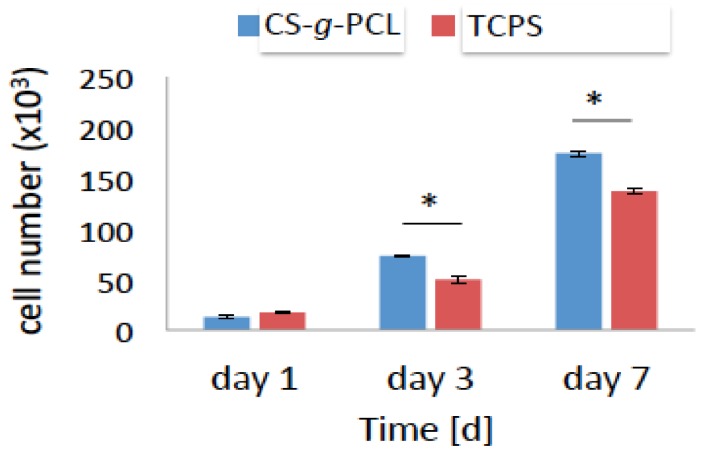
Figure 5.
Viability and proliferation assay showing the number of the MC3T3-E1 pre-osteoblastic cells cultured on the CS-g-PCL surface and on tissue culture treated polystyrene (TCPS) after 1, 3, 7 days in culture. Optical density values of viability are normalized to the cell number using a calibration curve. The number of cells cultured on the CS-g-PCL surfaces was similar to those on TCPS 1 day after seeding but after 3 and 7 days it was significantly higher for the cells cultured on the CS-g-PCL copolymer surface.

