Figure 7.
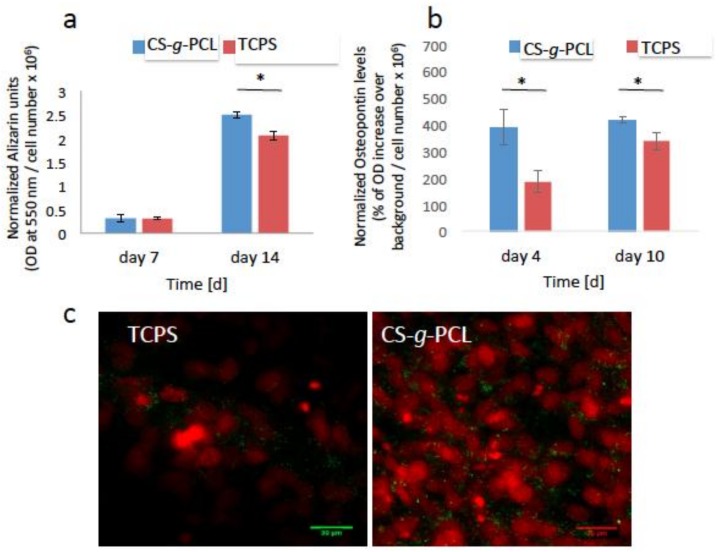
Late markers of osteogenesis normalized by the cell number: (a) Calcium biomineralization by Alizarin Red S staining of the MC3T3-E1 cells cultured for 7 and 14 days on CS-g-PCL and TCPS. The matrix mineralization of the copolymer substrate was significantly increased compared to TCPS after 14 days of culture; (b) Measurement of the endogenous levels of osteopontin of the pre-osteoblastic cells cultured on the two material surfaces for 4 and 10 days. Osteopontin levels were significantly higher on the CS-g-PCL surfaces compared to TCPS after 4 and 10 days in culture; (c) Confocal microscopy images demonstrate the endogenous expression of osteopontin on the two material surfaces 10 days after seeding. Osteopontin is depicted in green around the red cell nuclei. The expression is higher for cells cultured on the CS-g-PCL surface compared to TCPS 10 days after seeding. Original magnifications are 40× and scale bars represent 30 μm. Error bars represent the average of triplicates ± SEM of two independent experiments (n = 6).

