
Figure 1. Onco-immune gene expression analysis.
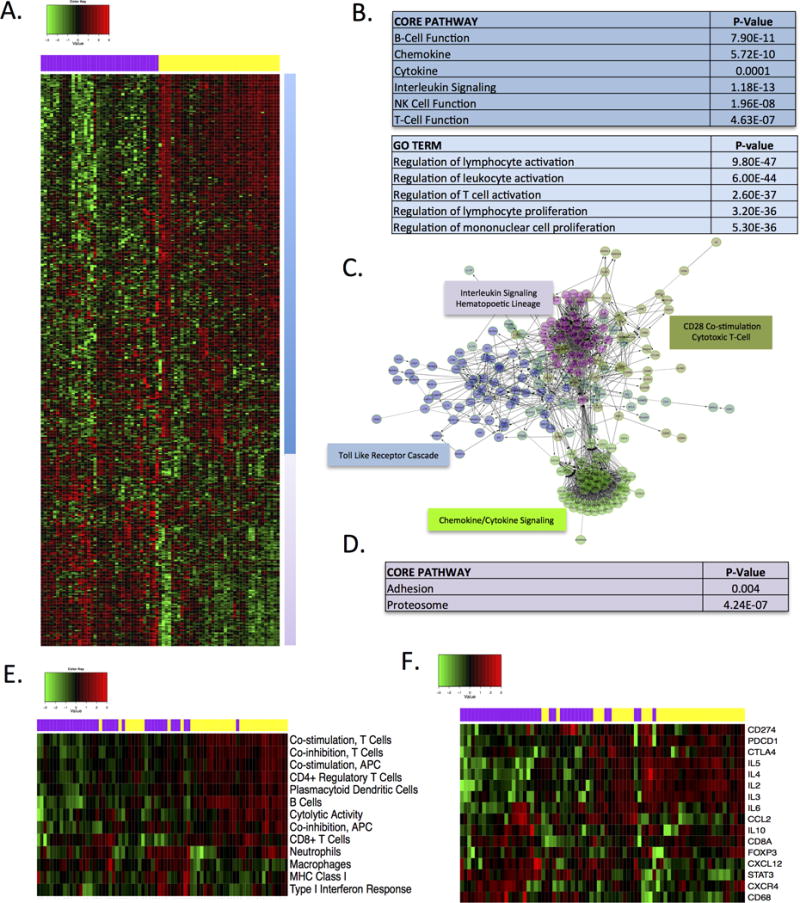
(A) Heatmap demonstrating two principle expression behaviors of genes within the HTG oncoimmunology panel. (B) The yellow cluster is significantly enriched for multiple genes involved in T- and C-cell activation. (C) Example of gene networks significantly enriched within the yellow cluster. (D) The purple cluster is enriched for genes involved in adhesion and proteasome function. (E) Heatmap of gene expression signatures associated with specific branches of the immune system. Color-bar denotes canonical cluster from unsupervised analysis. (F) Expression of select genes involved in immune activation and evasion are shown. Coloar-bar denotes the canonical cluster from the unsupervised analysis.