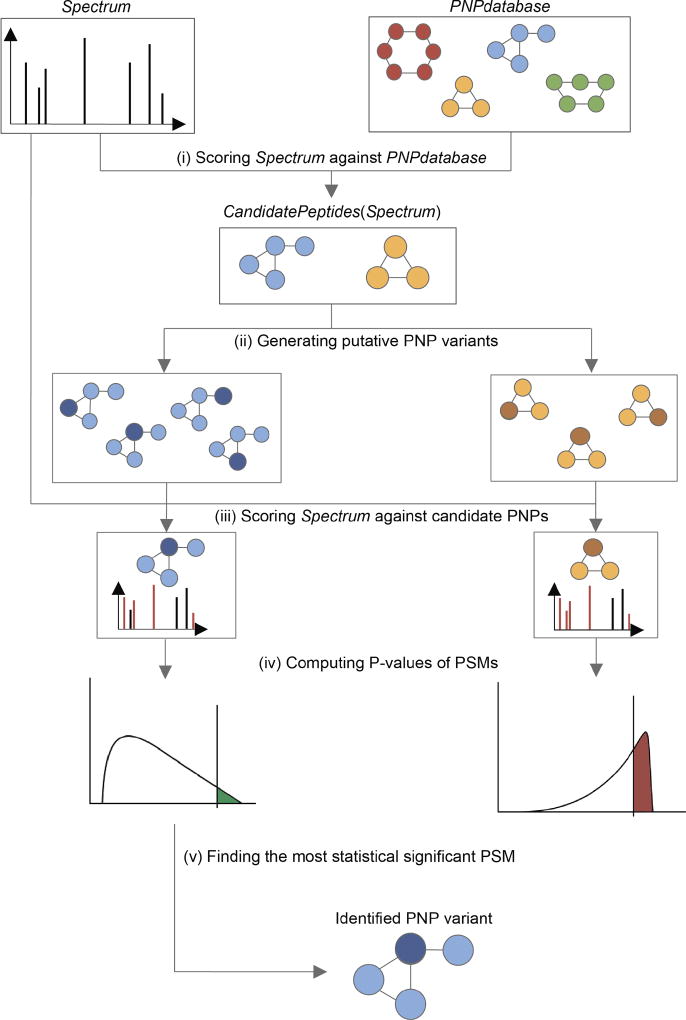
Figure 2. VarQuest pipeline.
For a spectrum and a PNP database, VarQuest starts from scoring the spectrum against the entire database (i) to form the list of candidate PNPs. All possible modifications are considered for each candidate (ii) and the spectrum is scored against all variants (iii) to select the highest scoring variant per candidate PNP. Statistical significance of the scores is computed (iv) and the most statistically significant PSM is reported (v).

