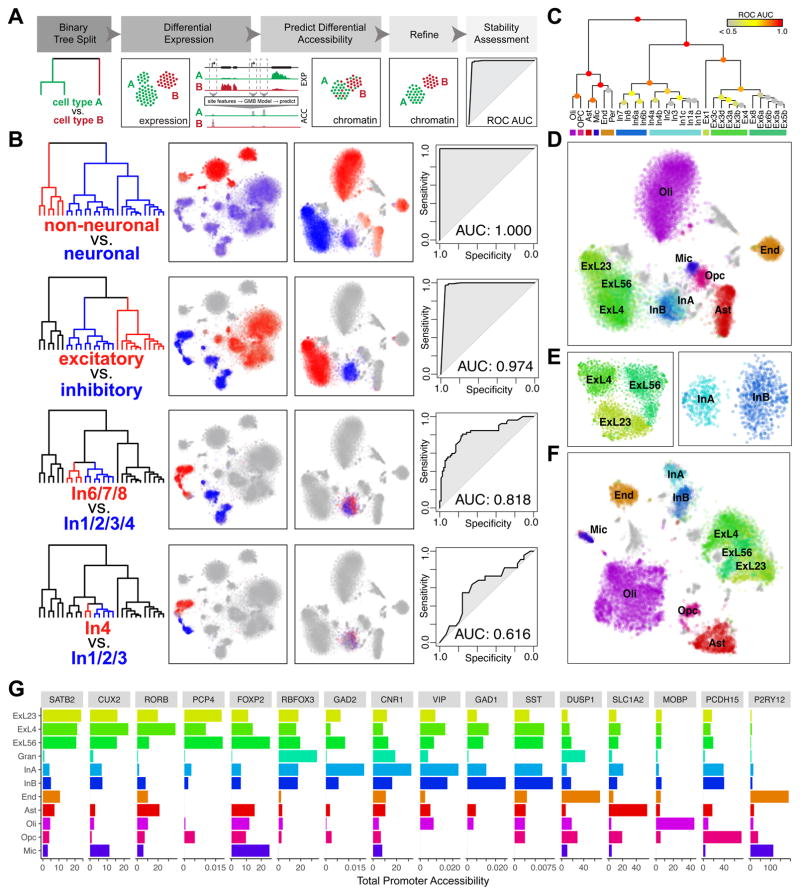
Fig. 3.
Integrative mapping of transcriptional and epigenetic subtypes. A. Overview. First, a taxonomy of cell types is constructed based on the expression data. For each binary split in the transcriptional taxonomy, a set of genes differentially expressed between the two branches is identified. A GBM model is used to predict a set of differentially accessible chromatin sites corresponding to the identified differential expression signature, to classify scTHS-seq cells as belonging to either branch. Predicted branch annotations are refined by identifying differentially accessible sites using scTHS-seq data. Stability of the branch annotations is assessed using cross-validation (see Methods). B. Identification of In neuron subpopulations using the integrative approach. In the top binary split of transcriptional taxonomy, neuronal cells are separated from non-neuronal cells. Differentially expressed genes (Z > 1.96) are identified. Average expression of genes significantly upregulated in each branch is shown, with red corresponding to high expression in the red branch and blue corresponding to high expression in the blue branch. Predicted differentially accessible sites are visualized in the same way. Prediction performance, as assessed by ROC curves and AUC, demonstrates high stability of split for non-neuronal vs. neuronal, Ex vs. In, and In1,2,3,4 vs. In6,7,8 but not In4 vs. In1,2,3. C. Summary of stability for each binary split of transcriptional taxonomy. D. Final cell type predictions from the integrated analysis projected onto the original visual cortex scTHS-seq data t-SNE embedding. E. Refinement of the visual cortex scTHS-seq data t-SNE embedding for Ex (left) and In (right) subpopulations only, integrating predicted differentially accessible sites. F. Refinement of the complete visual cortex scTHS-seq data t-SNE integrating predicted differentially accessible sites. G. Accessibility of select marker genes. Read mapping to promoters of each gene for all cells within each epigenetic subpopulation from (F) are averaged for number of sites and cells for comparison across subpopulations.

