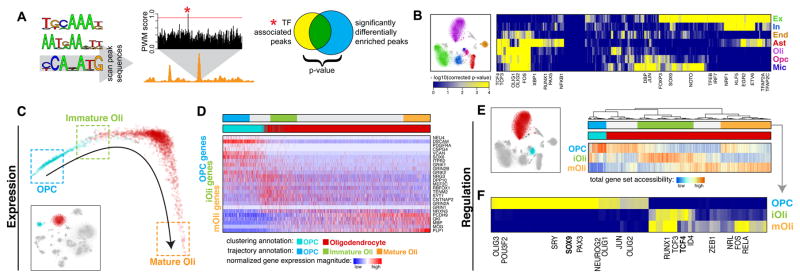
Fig. 4.
Mapping transcription factor (TF) activities to specific cell types to resolve remyelination programs. A. Schematic of TF analysis. Briefly, putative TF binding sites (TFBS) were identified within all hypersensitive sites based on matching position weight matrices (PWMs). To identify relevant factors for a given cell type, sites showing differential accessibility within that cell type were tested for statistical enrichment of different TFBS. B. Heatmap of TF association to epigenetic subpopulations (right). Each column is a TF. Each row is an epigenetic subpopulation from the visual cortex (left). Select TFs are annotated. C. Diffusion map pseudotime trajectory for OPCs and Oli snDrop-Seq datasets from the visual cortex (shown as inset). Datasets are colored by the original dataset annotations from clustering analysis. Refined annotations based on the inferred pseudotime trajectory are shown as boxes. D. Heatmap of select genes involved in remyelination program. Columns are datasets ordered by the pseudotime trajectory in (C). Rows are genes ordered by association with OPCs, iOli, and mOli based on significance of differential upregulation in each group. E. Accessibility of genes involved in remyelination programs for OPCs and Oli scTHS-Seq datasets from the visual cortex (left). Heatmap of total promoter accessibility (right). Each column is a cell. Each row represents accessibility for genes differentially upregulated in OPCs, iOli, and mOli respectively. F. Heatmap of TF association to stages of Oli maturation. Each column is a TF. Each row is an epigenetic subpopulation inferred from (E). Select TFs are annotated.

