Figure 3.

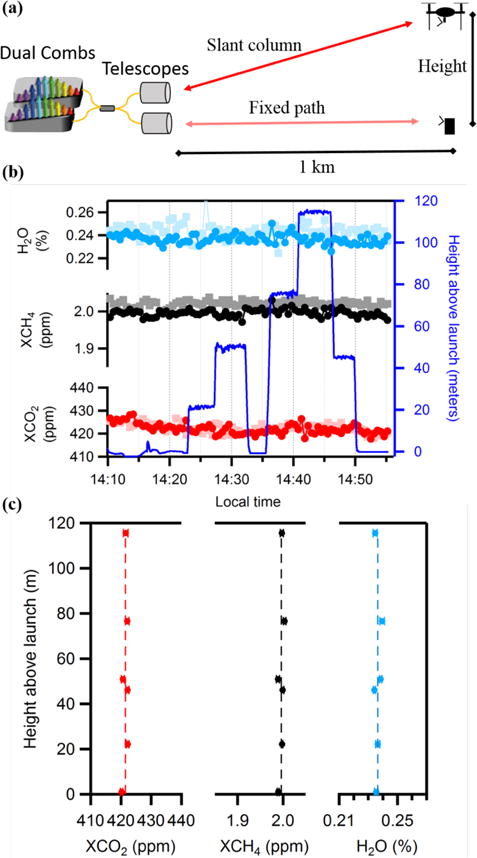
Results of a flight to obtain a vertical concentration profile. (a) Diagram showing simultaneous slant column and fixed path measurements. (b) The path-corrected H2O (medium blue), dry CH4 (black), and dry CO2 (red) mixing ratios obtained for 32-s averaged data from the sUAS-DCS. The data in lighter colors were obtained along the fixed path. The corresponding retroreflector height above ground (from the RTK GPS) is also shown (right axis, dark blue). (c) Slant-column mixing ratio versus altitude from averaging approximately ten points over 4–5 minutes at each height in (b). The error bars are the standard error of the mean. Averaged over height (dashed line), the mixing ratios are 421.5 ± 0.9 ppm, 1.996 ± 0.006 ppm, and 0.236 ± 0.002 % for CO2, CH4, and H2O, respectively. The scatter about the mean is attributed to temporal, rather than spatial, variations under these well-mixed conditions.
