Figure 3.

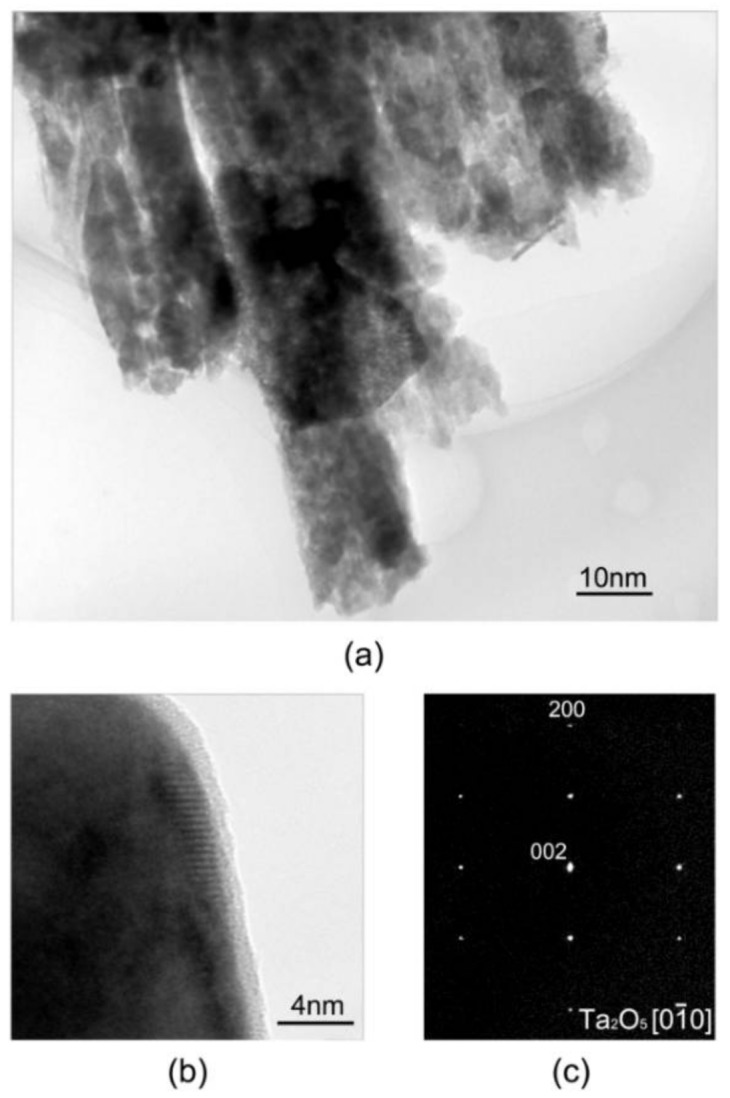
TEM image and high resolution TEM image of nanotube(s) (a,b); the SADPs taken from the orthorhombic Ta2O5 phase (c) (the zone axis indices are indicated).

TEM image and high resolution TEM image of nanotube(s) (a,b); the SADPs taken from the orthorhombic Ta2O5 phase (c) (the zone axis indices are indicated).