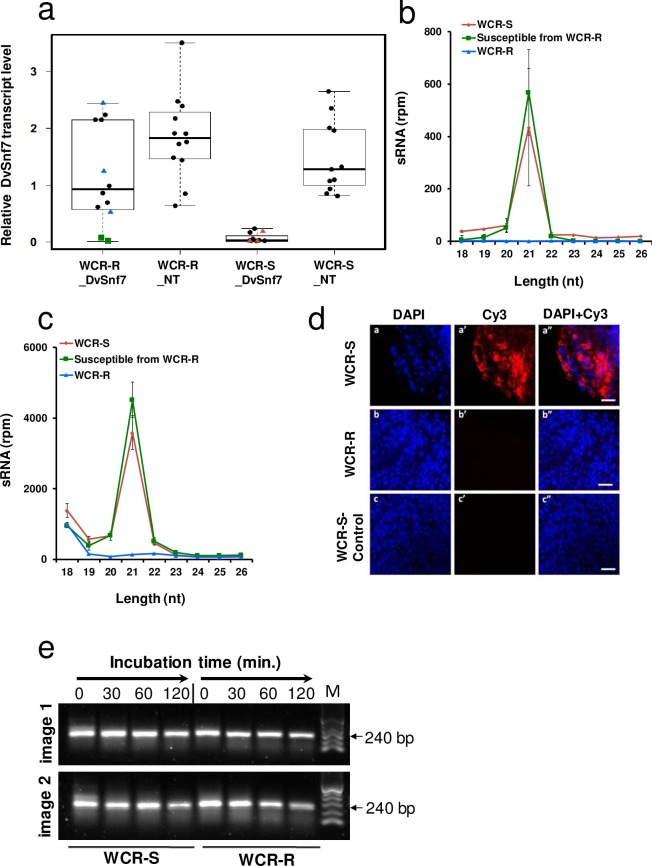
Fig 4. DsRNA uptake, and not degradation, is altered in WCR-R.
(a) Transcript levels of DvSnf7 in the carcass of larvae fed either DvSnf7 or non-transgenic (NT) maize roots. Each dot represents the transcript level from a single larva. Larvae represented by blue triangles (3 larvae) and green squares (2 larvae) from WCR-R, and red triangles (3 larvae) from WCR-S were selected for sRNA sequencing (b) sRNA reads mapped to the DvSnf7 240-bp dsRNA that were identified from the carcass of WCR-S and WCR-R individual larvae fed DvSnf7 maize roots. The Y-axis is sRNA reads per million (rpm) and the X-axis is the length of sRNA in nucleotides (nt). (c) sRNA reads mapped to maize endogenous dsRNA that were identified from the carcass of the individual larvae reared on DvSnf7 maize roots. The same sRNA dataset as for Fig 4B was used for this analysis. (d) Uptake of Cy3-labeled DvSnf7 240-mer dsRNA in WCR-S midgut cells (a’), while uptake of Cy3-labeled 240bp DvSnf7 dsRNA was not observed in WCR-R midgut cells (b’). Controls with Cy-3 dye alone did not show intracellular incorporation of Cy3-labeled DvSnf7 240-mer dsRNA (c’); DAPI staining of nuclei was used to visualize midgut cells (a,b,c) and overlaid with Cy3 staining (a”,b”,c”). Representative images of 8–9 midguts per treatment per experiment are shown. Scale Bar: 50 μm. (e) Agarose gel image showing intact dsRNA when incubated with midgut juice extract from 10 WCR-R and WCR-S larvae. DvSnf7 dsRNA (1 μg) was incubated with 5 (image 1) or 10 μg (image 2) of total midgut protein extracted from isolated midgut tissue. Aliquots of the incubations were drawn at the times indicated, quenched by ethanol precipitation, and resolved by agarose gel electrophoresis. M = 100 bp DNA Ladder. (b and c) Means ± SEM.

