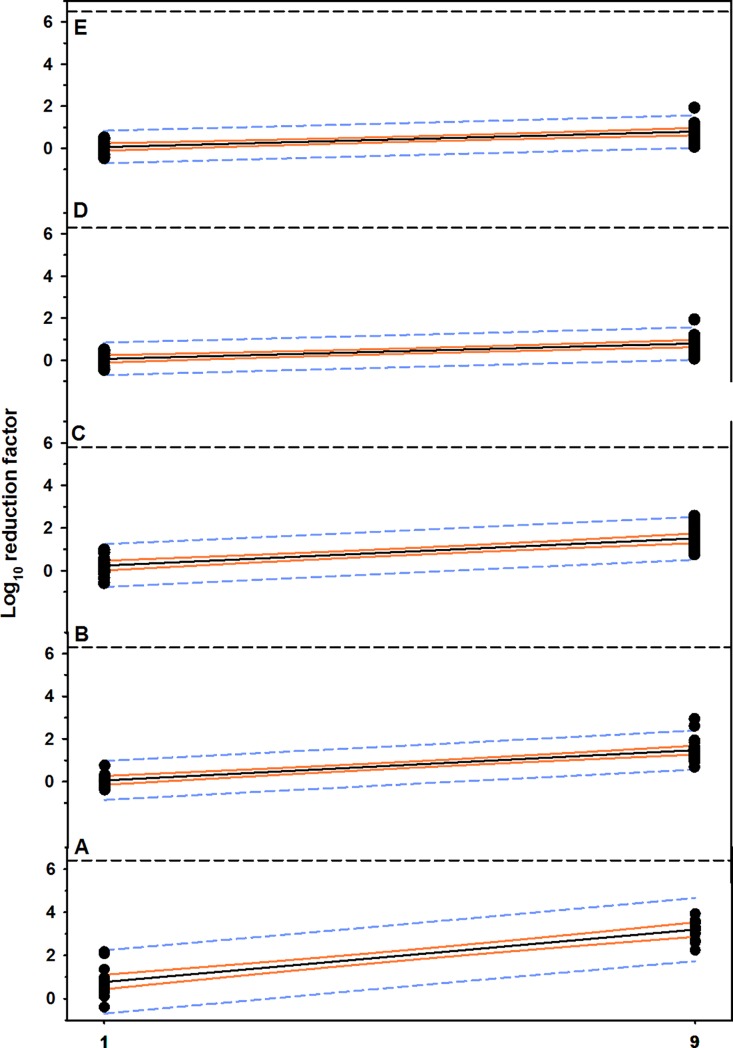
Fig 4. Scatterplot of the linear relationship between concentrations of gaseous O3 and rate of MBP reduction.
(A) Plastic, (B) metal, (C) nylon, (D) rubber, and (E) wood materials contaminated with dairy cattle manure. The solid black line is the regression line, the solid orange line is the 95% confidence interval for the regression line, and the short dashed line is the 95% confidence interval for prediction. The horizontal short dashed line is 100 killing percentage (mean cell counts of control groups).

