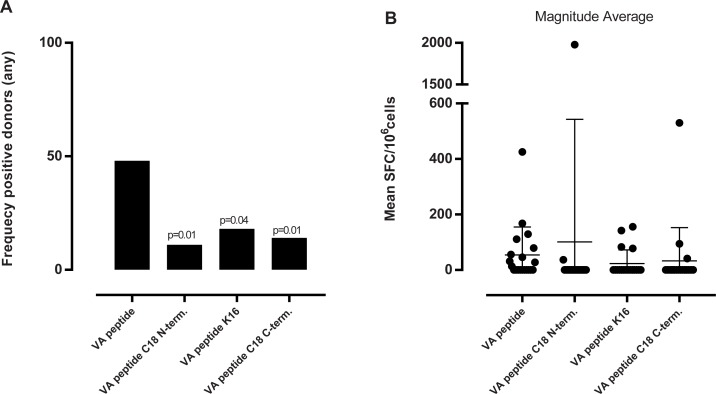
Fig 7. Summary of frequency of responding donors and magnitude of response to the vatreptacog alfa peptide of all cytokines in all donors.
(A) the graph shows the frequency of responding donors to all cytokines (eg one positive hit for one cytokine equals a positive donor) and (B) the graph the corresponding magnitude of the response expressed as mean spot forming cells (SFC)/106 cells for all cytokines. n = 22. One-sided Fisher’s test was used to calculate the p value in (A). VA: vatreptacog alfa peptide.

