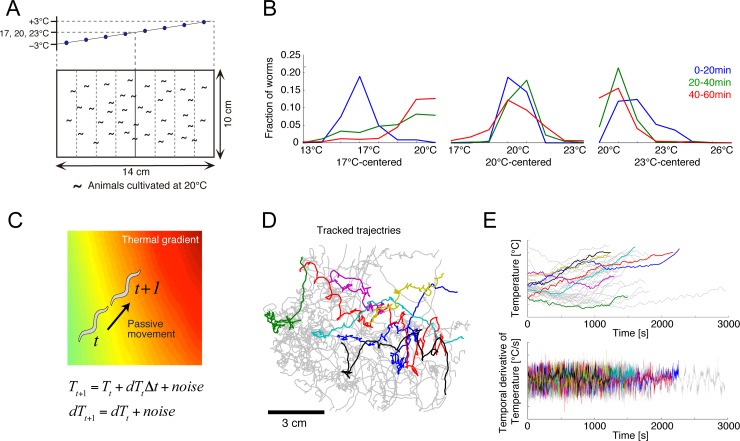
Fig 2. Thermotactic behavior in C. elegans.
(A) Thermotaxis assays including a thermal gradient. In each assay, a linear temperature gradient was set along the agar surface, whose center was set at either 17, 20, or 23°C. At the onset of the assay, fed or starved worms were placed at the center of the agar surface. (B) Temporal changes in the spatial distribution of the fed worms under the 17°C-, 20°C- and 23°C-centered thermal gradients. (C) Passive dynamics of persistent migration on a linear thermal gradient. (D) Representative trajectories of worms extracted by the multi-worm tracking system (n = 33 in this panel). Different colors indicate individual worms. (E) Time series of the temperature and its derivative experienced by the migrating worms shown in C (colors correspond to those in D).

