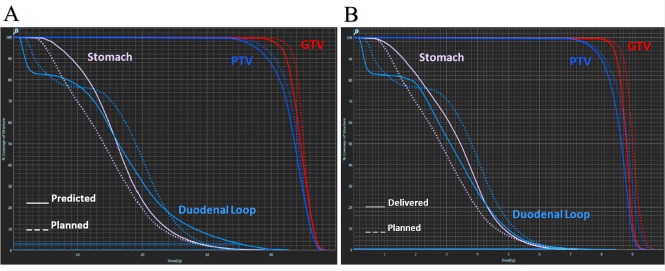
Figure 2. A) Dose-volume histogram comparing the treatment plan dosimetry with predicted doses based on fraction 4’s anatomy. The predicted plan significantly violates the prescribed dose constraints for the duodenal loop and stomach and inadequately covers the treatment target. B) Dose-volume histogram illustrating the adapted (delivered) treatment plan. The radiation dose to the organs at risk has been greatly reduced, while PTV coverage has been increased.
(GTV - Gross tumor volume; PTV - Planning target volume)

