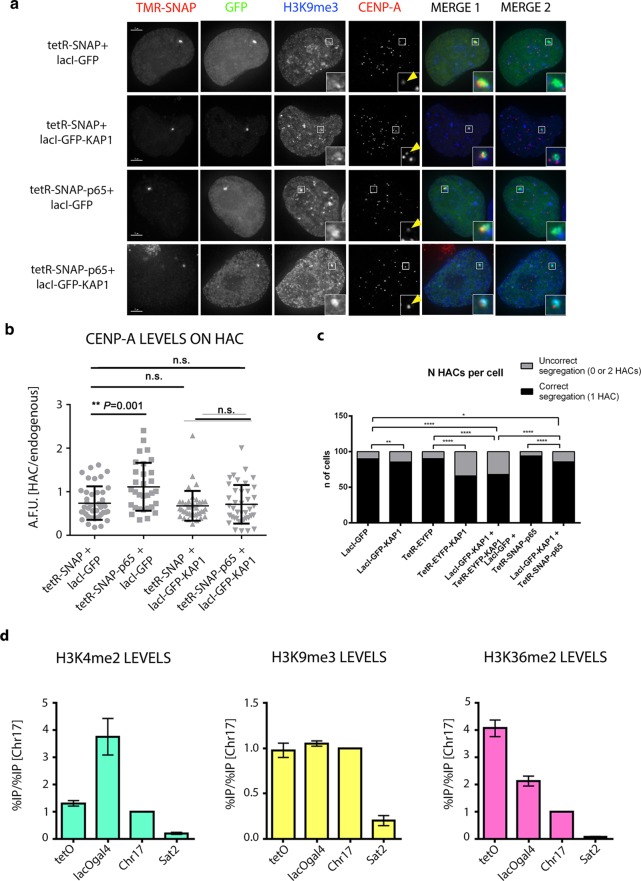
Figure 8.
Alphoidhybrid HAC shows epigenetically distinct centromeric domains. (a) Representative images of HT1080–5B10 cells expressing the indicated tetR (first panel) and lacI-fusion proteins (second panel) and stained with antibodies recognizing H3K9me3 (third panel) and CENP-A (fourth panel). Merged images represent the overlay of TMR-SNAP, GFP, and H3K9me3 (MERGE 1; fifth panel) and GFP, H3K9me3 and CENP-A (MERGE 2; sixth panel). (b) Quantification of HAC-associated CENP-A staining in individual cells transfected with the indicated fusion proteins and plotted as A.F.U. Solid bars indicate the medians, and error bars represent the s.e.m. n = two independent experiments for each time point and staining. Asterisks indicate a significant difference (**P < 0.01; Mann–Whitney test). (c) Quantification of alphoidhybrid HAC copy-numbers as determined by counting the GFP and/or TMR-SNAP spot in interphase nuclei of cells transfected with the indicated fusion proteins. Data represent the mean (and s.e.m.) of three independent assays of each time point after doxycycline washout (n = 1,000 nuclei per condition; *P < 0.05, **P < 0.0001; χ2-test). (d) ChIP-qPCR analysis in HT1080–5B10 cells using the indicated antibodies. The α21-I-tetO (tetO), α21-II-lacOgal4 (lacOgal4) hybridHAC domains, the satellite D17Z1 (Chr17), and the degenerate satellite type-II (Sat2) repeats were assessed. Scale bars = 10 μm.

