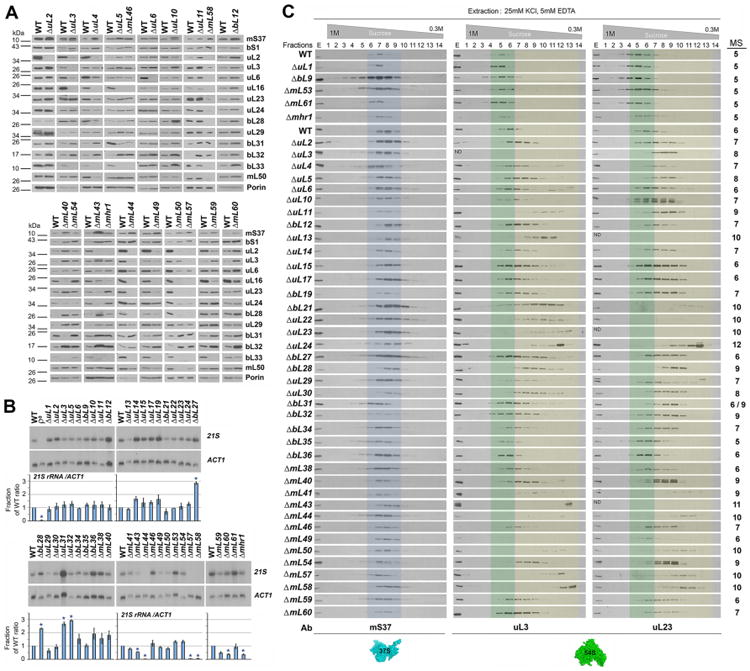
Fig 2. Altered accumulation of mtLSU proteins, 21S rRNA and subassemblies in MRP mutant strains. See also Figure S2.

A. Immunoblot analyses of the steady-state levels of the indicated MRP proteins in WT and a selection of MRP mutant strains. Porin was used as loading control.
B. Steady-state level of 21S rRNA analyzed by northern blotting using total cellular RNA. The lower panel shows the densitometry values normalized by the signal of ACT1 and expressed relative to the WT. n=3 biological replicates. Data are mean ± SD. *p<0.05.
C. Sucrose gradient sedimentation analyses of mt-SSU (mS37) and mt-LSU proteins (uL3 and uL23) in mitochondrial extracts from the indicated strains, prepared in the presence of 25 mM KCl, 5 mM EDTA and 0.8% Triton X-100. Transparent blue and green colors mark the fractions where the WT mtSSU and mtLSU sediment, respectively. Transparent yellow color labels the fractions where mtLSU subassemblies accumulate. The fractions from these gradients that were subsequently used for mass spectrometry (MS) analyses of mitoribosome subunits and assembly factors are indicated on the right side of the figure. Ab, antibodies used.
