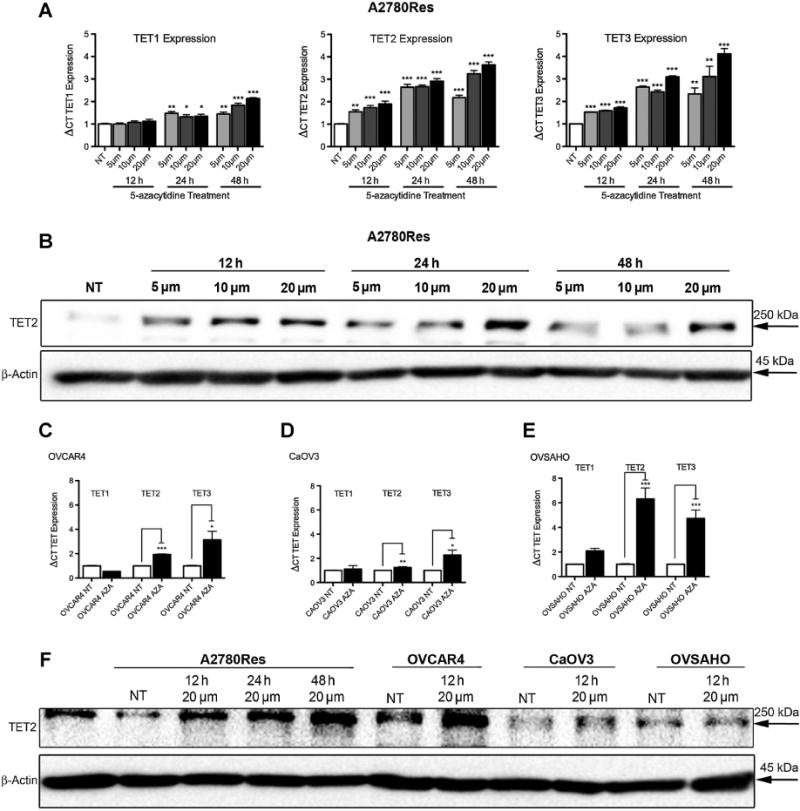
Figure 5.

Pretreatment with 5-azacytidine increases TET2 and TET3 expression in ovarian cancer cell lines. A, Comparative mRNA expression levels of TET1, TET2, and TET3 in the A2780Res tumor line following 5-aza treatment (concentrations of 5, 10, and 20 μmol/L, respectively) at various timepoints (treatment time of 12, 24, and 48 hours, respectively) as assessed by qRT-PCR. TET2 and TET3 are significantly upregulated at all concentrations and timepoints relative to untreated cells (NT) (**, P < 0.01; ***, P < 0.001). B, TET2 protein levels in A2780Res cells treated with 5-aza at concentrations of 5, 10, and 20 μmol/L for 12, 24, and 48 hours, respectively, as assessed by Western blot analysis. There is an increase in TET2 expression when compared with untreated (NT) cells. C–E, Comparative mRNA expression levels of TET1, TET2, and TET3 in OVCAR4, CaOV3, and OVSAHO ovarian cancer cell lines, respectively, following 12 hours of 5-aza (20 μmol/L) treatment as assessed by qRT-PCR. TET2 and TET3 are significantly upregulated in all cell lines following 5-aza treatment compared with untreated (NT) cells (*, P < 0.05; **, P < 0.01; ***, P < 0.001). F, TET2 protein levels in ovarian cancer cell lines following treatment with 5-aza as assessed by Western blot analysis.
