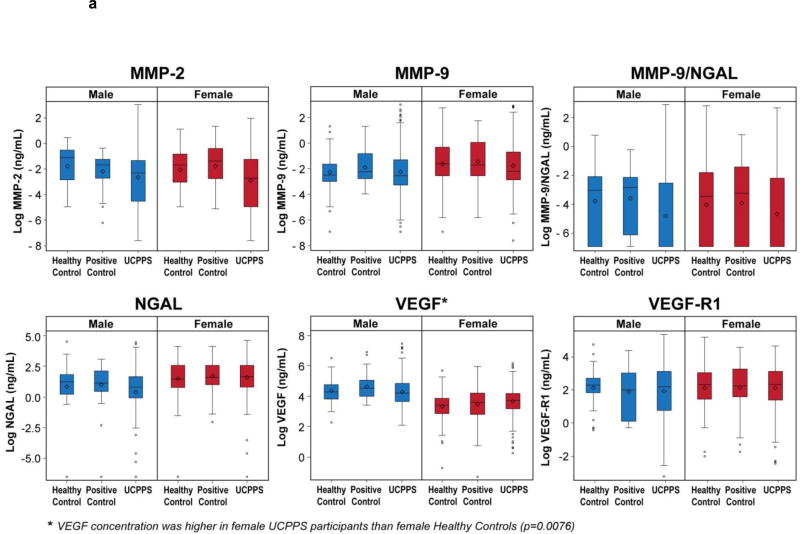
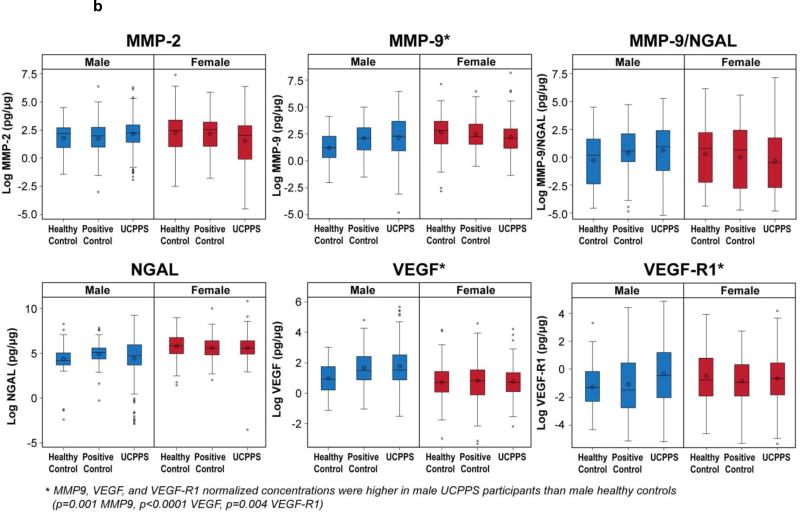
Figure 1.
Log biomarker concentrations (ng/mL or pg/mL, subfigure 1A) or normalized concentrations (pg/µg) are presented for male (blue) and female (red) participants by patient cohort (Healthy Control, Positive Control, or UCPPS). Candidate proteins that differed significantly by cohort within sex are indicated by ‘*’.
a Biomarker Concentration (ng/mL or pg/mL) by Cohort and Sex
b Biomarker Concentration Normalized to Total Protein (pg/µg) by Cohort and Sex


