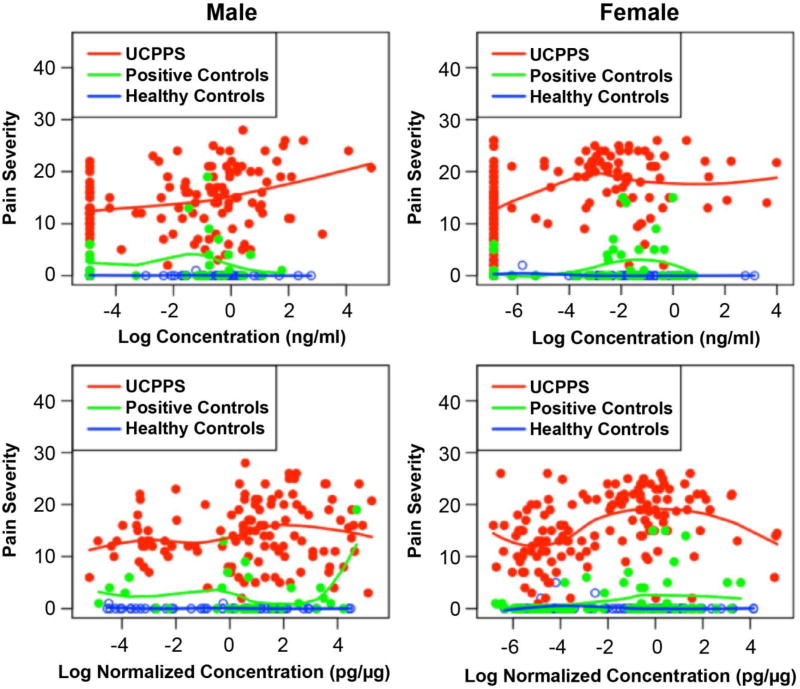
Figure 3.
Pain severity is plotted against MMP9/NGAL log concentration (ng/ml, top) or log normalized concentration (pg/µg, bottom) separately for male (left) and female (right) Urological Chronic Pelvic Pain Syndrome participants (UCPPS, red), Positive Controls (PC, green), and Healthy Controls (HC, blue). Trend lines were determined by locally weighted scatterplot smoothing.
Pain Severity and MMP9/NGAL by Cohort and Sex

