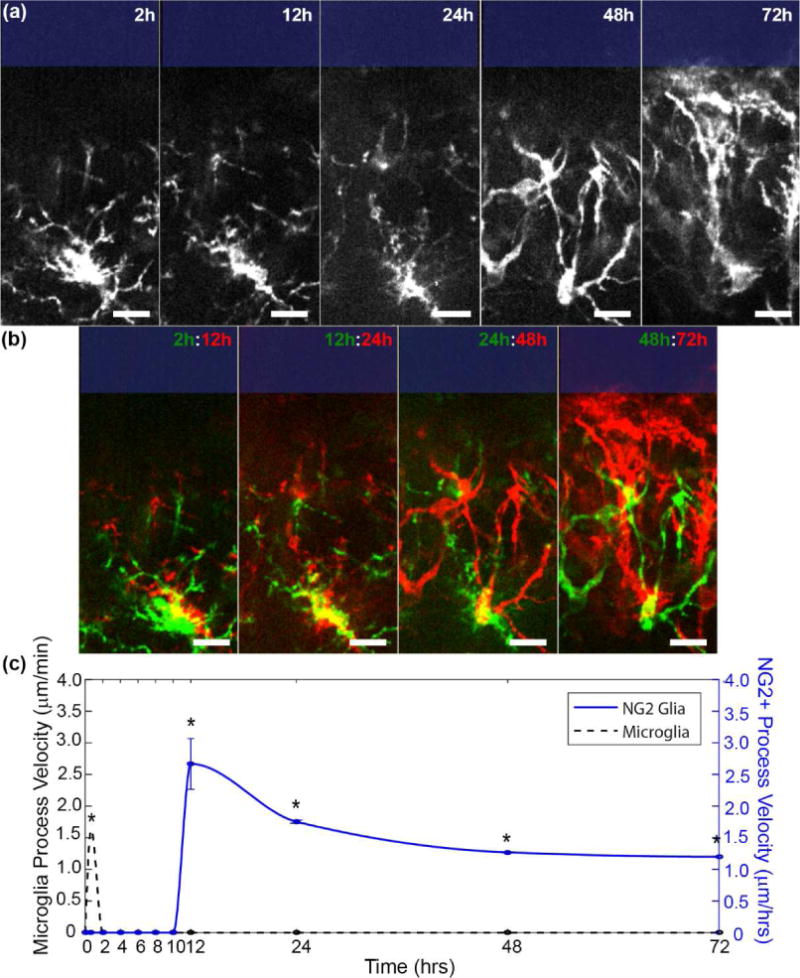
Figure 2. NG2 glia extend processes toward the probe beginning 12 hours post-insertion.

(a) NG2 glia processes extend toward the probe surface (blue rectangle). Scale bar = 15 μm. (b) Merged images of NG2 glia cell. Yellow denotes where pixels before and after overlap. Red indicates extended features while green denotes retracted features. Scale bar = 15 μm. (c) NG2 glia (blue) and microglia (black dashed) process velocities were tracked over time. Velocity data for acute microglia process migration within the first hour of insertion was obtained from [34]. * indicates p<0.05.
