
Figure 6. Distribution of microglia activation increases up to 72 hours after probe insertion.
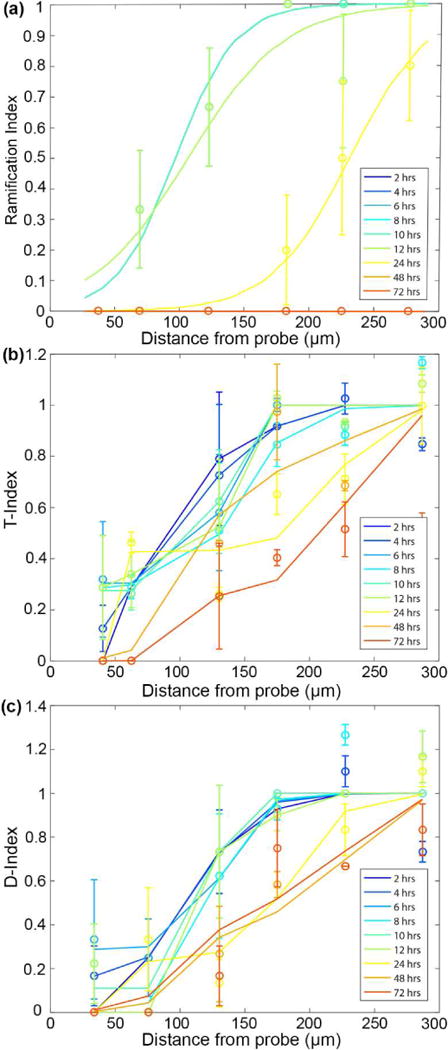
(a) Characterizing the ramification of microglia with distance from the probe surface. An index of 1 represents ramified morphology while an index of 0 represents activated, or transitional, microglia. (b) Transitional index of activated microglia where 1 represents processes extending equally in all directions and 0 represents leading processes extended toward the probe surface. (c) Directionality index of microglia where an index of 1 indicates equal number of processes extending toward and away the surface of the probe and an index of 0 indicates all processes extending toward the surface of the probe.