
Figure 2.
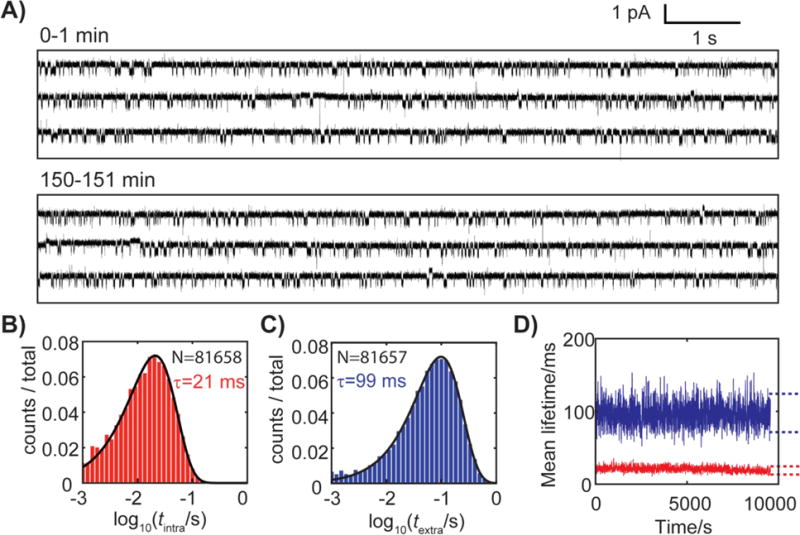
A) i-t trace for a dsDNA with a C:C mismatch captured in the α-HL nanopore at -70 mV and 20 °C. The molecule was held in the nanopore for ~2.8 h. Representative 1-minute traces recorded at the beginning and at 150 min of the experiment are shown. The electrolyte solution contains 250 mM KCl and 10 mM PB (pH 7.0). Log-binned dwell time histograms for B) intra-helical and C) extra-helical states of a C:C mismatch, from which state lifetimes (τ) are extracted. The black lines are best fits assuming mono-exponential distributions. D) Stability of the lifetimes of the extra-helical (blue) and intra-helical (red) state for a single dsDNA molecule captured for ~2.8 h. Each τ point in Figure 2D (not resolvable on the figure scale) is an average of 100 consecutive events (~15 s). Dashed lines are 99% confidence intervals for the average of 100 exponential random variables.