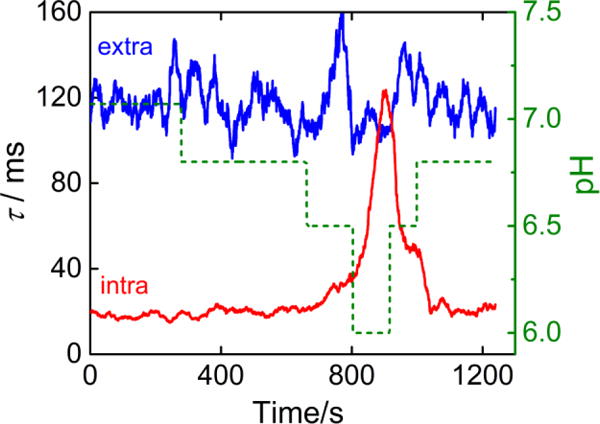
Figure 4.

Lifetimes of the extra-helical (blue) and intra-helical (red) states during the titration of a single captured dsDNA molecule in the α-HL nanopore. Lifetimes are obtained every 15 s. The solution pH is indicated by the green dashed line (right axis).
