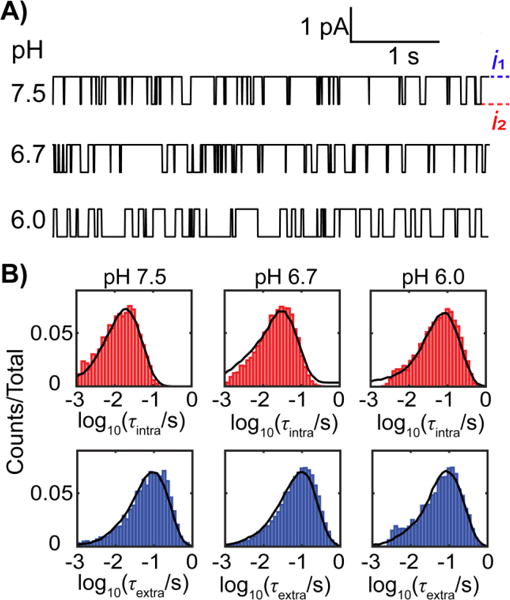
Figure 6.

A) Sample simulated i-t traces over a 10-s period for base flipping at different pH. B) Comparison of dwell time distribution between experiment (bars) and simulation (black lines) for the intra-helical state (top red) and the extra-helical state (bottom blue).
