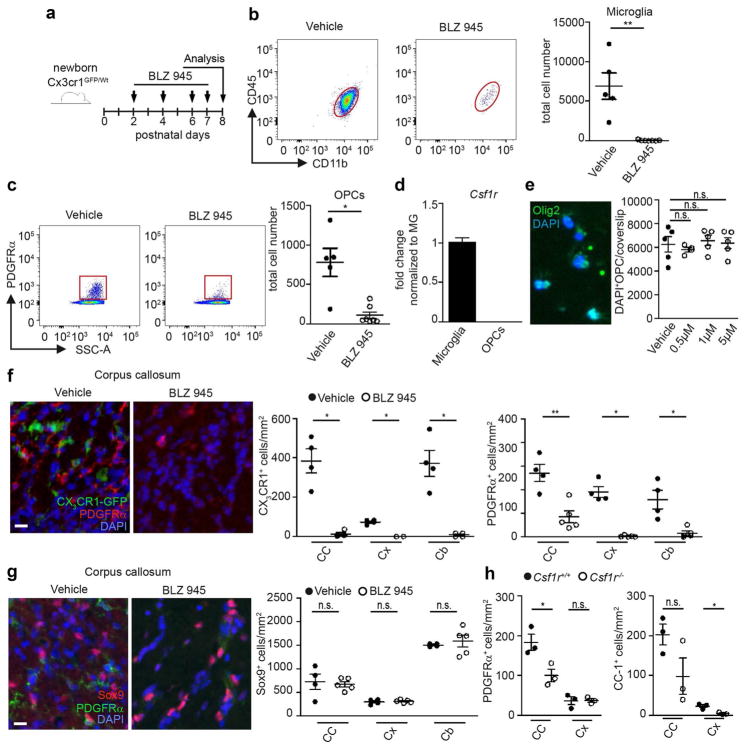
Fig. 3.
Essential role of microglia for adequate induction of oligodendrocyte progenitors. a Scheme of experimental setup. Cx3cr1GFP/Wt mice were injected intraperitoneally (i.p.) with BLZ945 at P2, P4, P6, and P7. Analysis was performed at P8. b, c Representative blots and quantification of flow cytometric analysis of CD45+CD11b+ microglia (b) and PDGFRα+ oligodendrocyte progenitors (OPCs; c) pre-gated on living cells, single cells, Gr1− cells of mice treated as depicted in a (n = 5–6, samples are from four independent experiments). Each symbol represents one mouse. Means with SEM are represented. Significant differences were determined by an unpaired t test: *P < 0.05, **P < 0.01. d Quantitative RT-PCR of Csf1r of sorted CD45+CD11b+ microglia and NG2+PDGFRα+ OPCs from P8 NG2YFP/Wt mice (n = 5). Data are normalized to Gapdh and β-Actin and presented as fold change to microglia levels. e Representative image of a primary postnatal OPC culture showing overlapping Olig2+/DAPI+ cells (left). OPC cultures were treated for 3 days with vehicle or different concentrations of BLZ945 (0.5, 1, and 5 μM). The number of DAPI+OPCs/coverslip did not change after treatment compared to the vehicle controls. f Representative immunofluorescent images (left) of the corpus callosum showing CX3CR1+ (green) microglia and PDGFRα+ (red) OPCs in vehicle or BLZ945-treated mice. Right quantification of these cells in the corpus callosum (CC), cortex (Cx), and cerebellum (Cb). Each symbol represents one mouse. Means with SEM are represented. n = 4; samples from two independent experiments. Scale bar 40 μm. Significant differences were examined by an unpaired t test and marked with asterisks (*P < 0.05, **P < 0.01). g Representative immunofluorescent images (left) of the corpus callosum showing Sox9+ (red) astrocytes and PDGFRα+ (green) OPCs in vehicle or BLZ945-treated mice. Right quantification of Sox9+/PDGFRα− astrocytes in the corpus callosum (CC), cortex (Cx), and cerebellum (Cb). n = 4–5; samples from two independent experiments. Scale bar 40 μm. Significant differences were examined by an unpaired t test. n.s. not significant. h Quantification of PDGFRα+ OPCs and CC1+ oligodendrocytes in the corpus callosum (CC) and cortex (Cx) of P20 Csf1r+/+ and Csf1r−/− mice. Significant differences were examined by an unpaired t test and marked with asterisks (*P < 0.05). n.s. not significant

