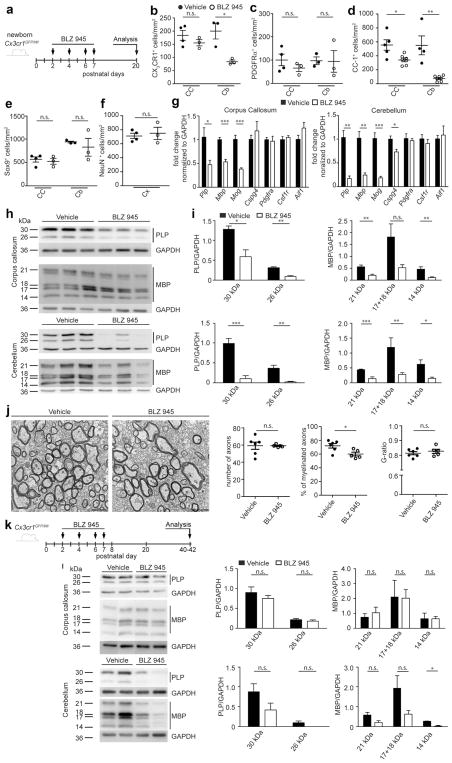
Fig. 4.
Reduced postnatal myelinogenesis in microglia-depleted mice. a Scheme of experimental setup. Cx3cr1GFP/Wt mice were injected intraperitoneally (i.p.) with BLZ945 at P2, P4, P6, and P7. Analysis was done at P20. b–f Quantification of CX3CR1+ microglia (b), PDGFRα+ OPCs (c), CC1+ oligodendrocytes (d), Sox9+/PDGFRα− astrocytes (e), and NeuN+ neurons (f) in the indicated brain regions using immunohistochemically stained brain slices. Significant differences were examined by an unpaired t test and marked with asterisks (*P < 0.05, **P < 0.01). Each symbol represents one mouse. Bars represent mean ± SEM. g Quantitative RT-PCR of the genes proteolipid protein (Plp), myelin basic protein (Mbp), myelin oligodendrocyte glycoprotein (Mog), chondroitin sulfate proteoglycan 4 (Cspg4 = NG2), platelet derived growth factor receptor alpha (Pdgfrα), colony stimulating 1 receptor (Csf1r), and allograft inflammatory factor 1 (Aif1) in tissue isolated from the corpus callosum and cerebellum at P20 (n = 4; samples from two independent experiments). Data were normalized to Gapdh and β-actin and are presented as fold change normed to vehicle. Significant differences were examined by an unpaired t test and marked with asterisks (*P < 0.05, **P < 0.01, ***P < 0.001). h, i Western blot analysis for the myelin proteins proteolipid protein (PLP) and myelin basic protein (MBP) in the corpus callosum and cerebellum at P20. GAPDH was used as a loading control. Quantification (right) was performed by normalization of the myelin proteins to GAPDH. Significant differences were examined by an unpaired t test and marked with asterisks (*P < 0.05, **P < 0.01, ***P < 0.001). Bars indicate mean ± SEM. j Representative electron microscope images from the corpus callosum treated with vehicle or BLZ945 at P20 (left, scale bar 2 μm) and quantification thereof (right). The total number of axons (myelinated and non-myelinated cut off ≥0.5 μm), the percentage of myelinated axons of all axons, and the G-ratio (axon diameter/filament diameter) were quantified (n = 5–6; samples from two independent experiments). Each symbol represents one mouse. Mean ± SEM are presented. Significant differences were examined by an unpaired t test and marked with asterisks (*P < 0.05). k Scheme of experimental setup. Cx3cr1GFP/Wt mice were injected i.p. with BLZ945 at P2, P4, P6, and P7. Analysis was done at P40–42. l Western blot analysis for the myelin proteins PLP and MBP in the corpus callosum and cerebellum at P40–42. GAPDH was used as a loading control. Quantification (right) was performed by normalization of the myelin proteins to GAPDH. Significant differences were examined by an unpaired t test and marked with asterisks (*P < 0.05). Bars indicate mean ± SEM

