
Figure 3.
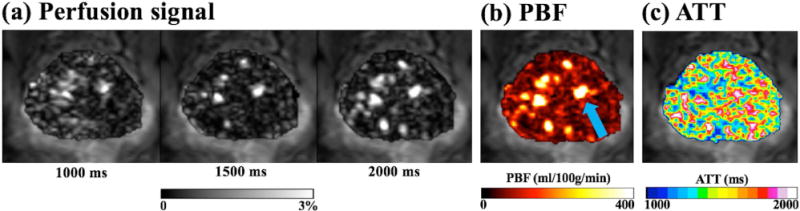
(a) Perfusion signal at PLD 1000/1500/2000 ms of a representative slice. (b) Calculated PBF maps. One of focal hyper-perfusion regions was indicated by a blue arrow. (c) Calculated ATT maps. Images are overlaid on the T2-weighted structural image measured by GRASE sequence.