
Figure 7.
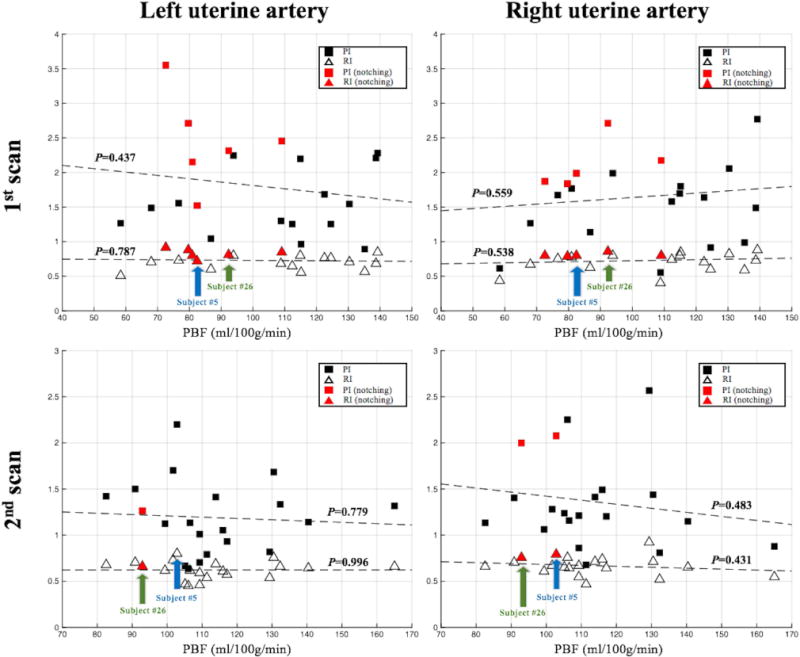
Scatter plot of resistance index (RI) and pulsatility index (PI) versus PBF values. Left and right column showed RI/PI from left and right uterine artery, respectively. Top and bottom row showed results acquired after the first and second MRI scans, respectively. Linear regression between RI/PI and PBF was illustrated by dashed lines, and no significant correlation was found (P values were listed next to each dashed line). Subjects with the early diastolic notch were labeled by red filled marks. Bilateral/unilateral notches presented in three/one subjects’ Doppler ultrasound waveform pattern acquired after the first MRI scan. Two subjects (subject #5 and #26) with persistent notches at two scans were identified by blue and green arrows. Bilateral/unilateral notches presented in subject #26/#5 Doppler ultrasound waveform pattern acquired after the second MRI scan.