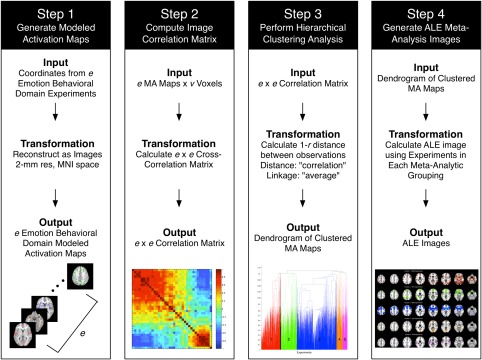
Figure 1.

Data analysis pipeline. Using a data‐driven approach, we categorized affective processing experiments according to similar brain activation architecture. Step 1: Experiments in the BrainMap database catalogued under the behavioral domain of Emotion were identified, and the corresponding activation coordinates were extracted and blurred using a Gaussian filter to generate modeled activation (MA) maps. Step 2: The three‐dimensional MA map of each experimental contrast was reduced to one‐dimension, and concatenated to create an experiment‐by‐voxel matrix. A cross‐correlation matrix was calculated to quantify the pair‐wise correlations between each experimental contrast's one‐dimensional MA map. Step 3: Hierarchical clustering was performed on this correlation matrix using the “correlation distance” method and “average linkage” method to define meta‐analytic groupings (MAGs) of experiments. Step 4: After identifying the most suitable number of MAGs, Activation Likelihood Estimation (ALE) images were calculated utilizing the experiment foci assigned to each MAG [Color figure can be viewed at http://wileyonlinelibrary.com]
