
Fig. 4.
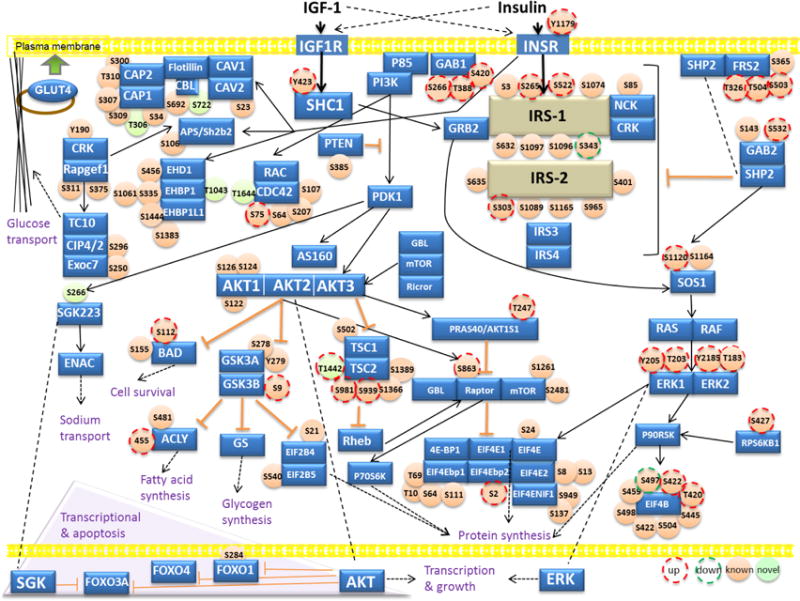
Insulin/IGF-1 signalling map. Non-phosphorylated proteins, non-regulated phosphoproteins, and regulated phosphoproteins are mapped to the pathway. The complete list of the proteins involved in insulin/IGF-1 pathway can be found in Table S5. Proteins known to be involved in insulin/IGF-1 pathway are represented in blue color; IRS-1 and IRS-2 are shown in beige color. Identified phosphosites by MS are shown in light orange, previously reported sites; light green, novel sites. The IGF-1 induced upregulated sites are shown with the surrounding red dash lines and the downregulated sites are marked with dark green dashed-circles. The inhibitory and positive relationship between different nodes of the signalling network is shown by orange and solid black arrows, respectively. The dashed lines point the same proteins located at different cell compartments, and dashed arrows indicate the final functional outputs of the pathway.